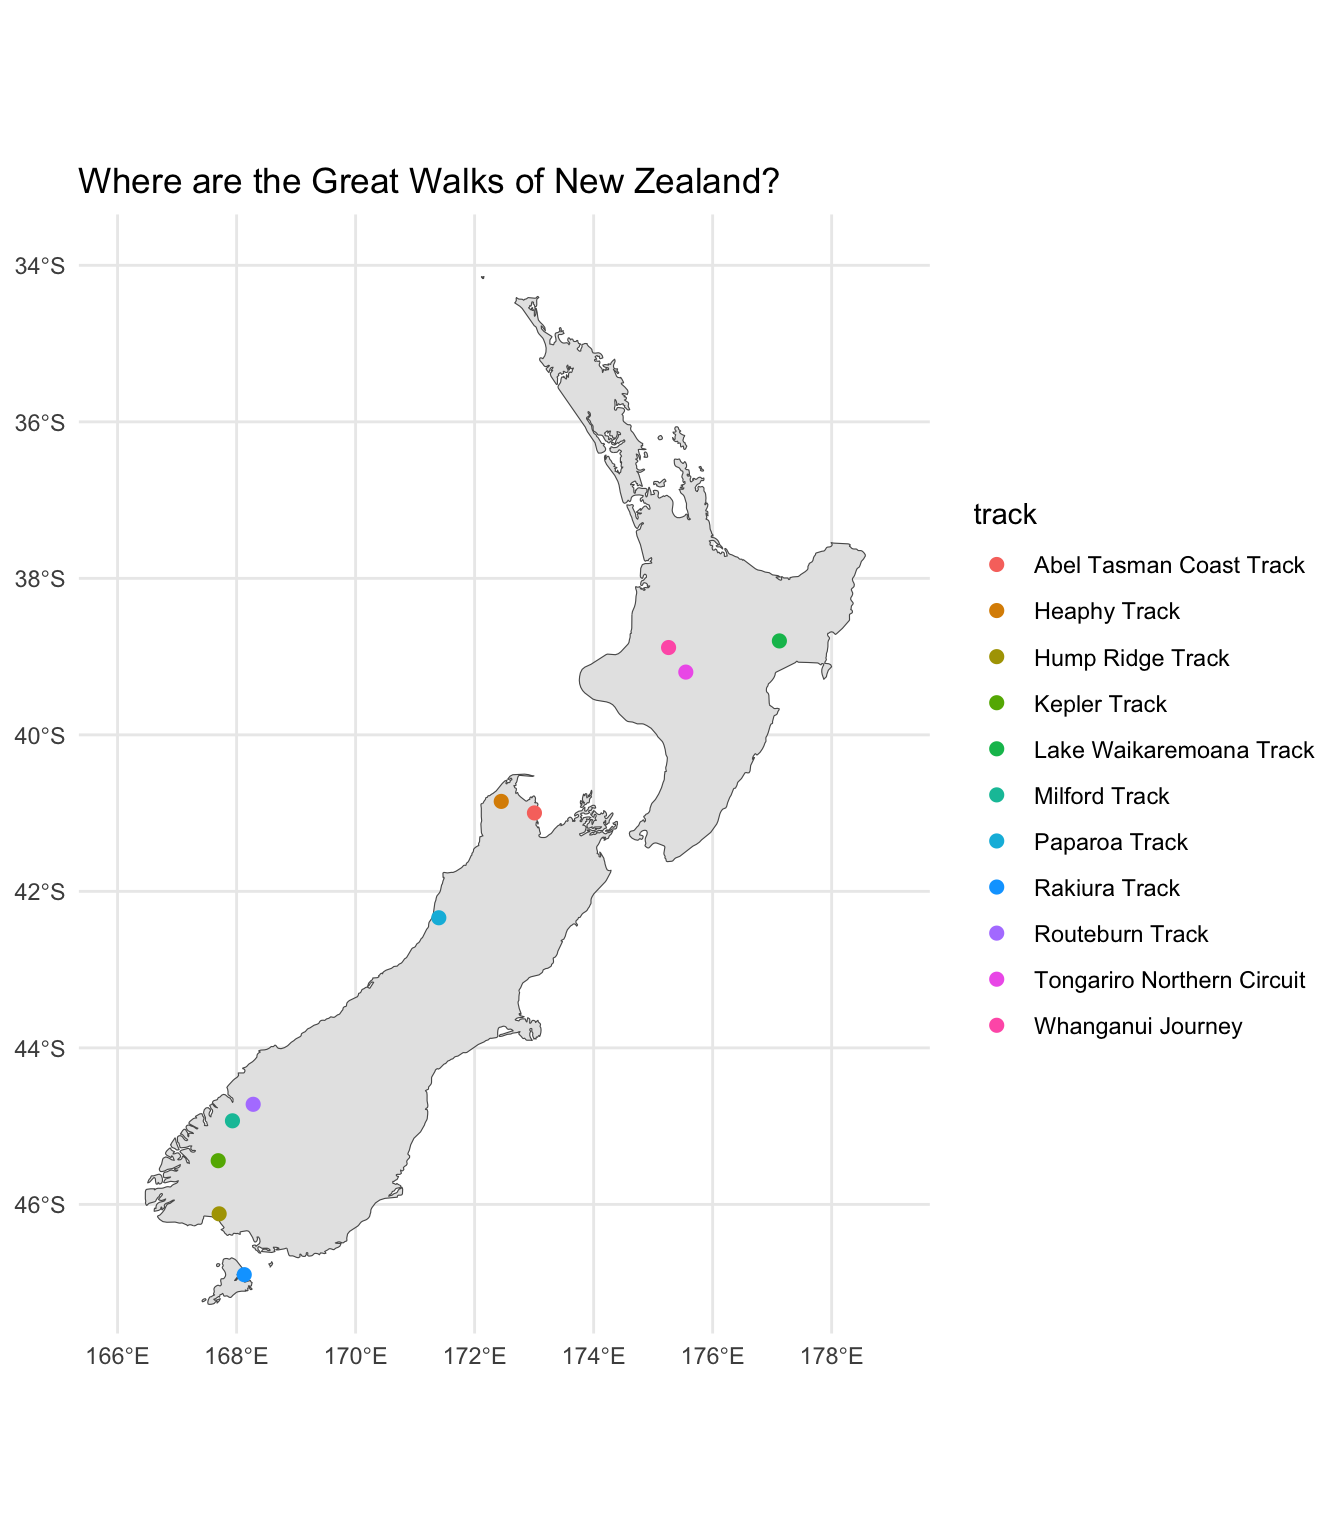
I am supposed to be hiking the Routeburn Track next week (if the waist-deep snow melts and the Harris Saddle is open) so thought I would start the #30DayMapChallenge with some data about New Zealand Great Walks.
tracks <- tracks %>%separate(start_lat_long, into =c("start_lat", "start_long"), ",") %>%separate(end_lat_long, into =c("end_lat", "end_long"), ",") %>%mutate(track_format = stringr::str_extract(location, "\\([^)]+\\)$"), # extract string within last brackettrack_format = stringr::str_remove_all(track_format, "[\\(\\)]"), # remove bracketslocation = stringr::str_remove(location, "\\s*\\([^)]+\\)$")) %>%# make everything but the bracket content locationmutate(start_location =str_extract(location, "^[^:]+"), # pull up to first : into start locationend_location =str_extract(location, "(?<=;\\s)[^:]+")) %>%# pull text after ; space up to :mutate(start_lat =as.numeric(start_lat), end_lat =as.numeric(end_lat), start_long =as.numeric(start_long), end_long =as.numeric(end_long))joined <-left_join(bookings, tracks, by ="track")total_year <- joined %>%group_by(year, track, start_lat, start_long, track_format) %>%summarise(total_bookings =sum(count))total23_24 <- total_year %>%filter(year =="2023-2024") %>%mutate(booking_category =cut(total_bookings, breaks =c(0, 5000, 10000, Inf),labels =c("Low (0-5k)", "Medium (5-10k)", "High (>10k)"))) %>%mutate(track_format =fct_relevel(track_format, c("one way", "river journey", "loop track")))
plot data
Code
nz <-ne_countries(country ="new zealand", returnclass ="sf", scale ="large")# first plot from tracks data to check locations, includes all 11 tracksggplot() +geom_sf(data = nz) +geom_point(data = tracks, aes(x = start_long, y = start_lat, colour = track), size =2) +coord_sf(xlim =c(166, 179), ylim =c(-47, -34)) +theme_minimal() +easy_remove_axes(which =c("both"), what =c("title")) +labs(title ="Where are the Great Walks of New Zealand?")
Code
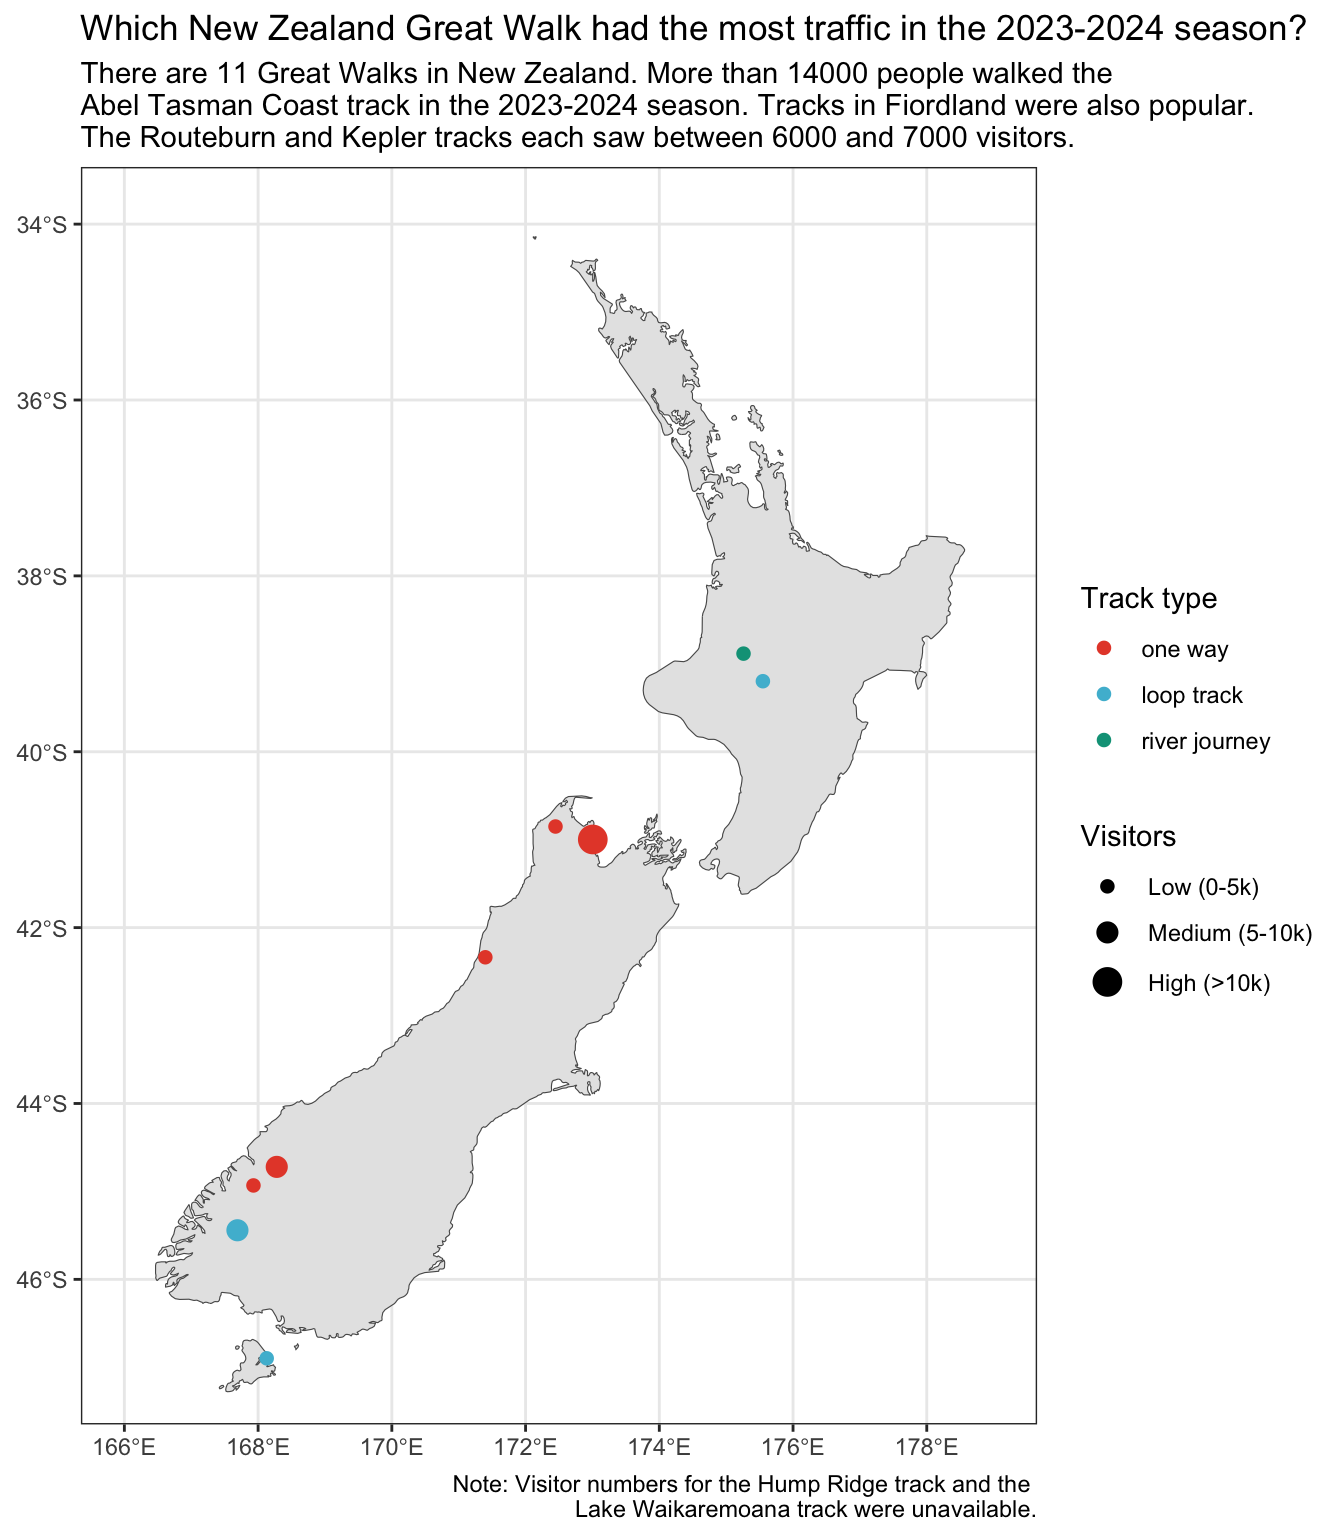
# then plot from 23-24 season from bookings joined data, only have booking data for 9 tracksggplot() +geom_sf(data = nz) +geom_point(data = total23_24, aes(x = start_long, y = start_lat, colour = track_format, size = booking_category), shape =20) +coord_sf(xlim =c(166, 179), ylim =c(-47, -34)) +theme_bw() +scale_size_manual(values =c(3, 5, 7), name ="Visitors") +easy_remove_axes(which =c("both"), what =c("title")) +scale_color_npg() +easy_add_legend_title("Track type") +guides(color =guide_legend(override.aes =list(size =3))) +# Larger dots in the legendlabs(title ="Which New Zealand Great Walk had the most traffic in the 2023-2024 season?", subtitle ="There are 11 Great Walks in New Zealand. More than 14000 people walked the \nAbel Tasman Coast track in the 2023-2024 season. Tracks in Fiordland were also popular. \nThe Routeburn and Kepler tracks each saw between 6000 and 7000 visitors.", caption ="Note: Visitor numbers for the Hump Ridge track and the \nLake Waikaremoana track were unavailable.")