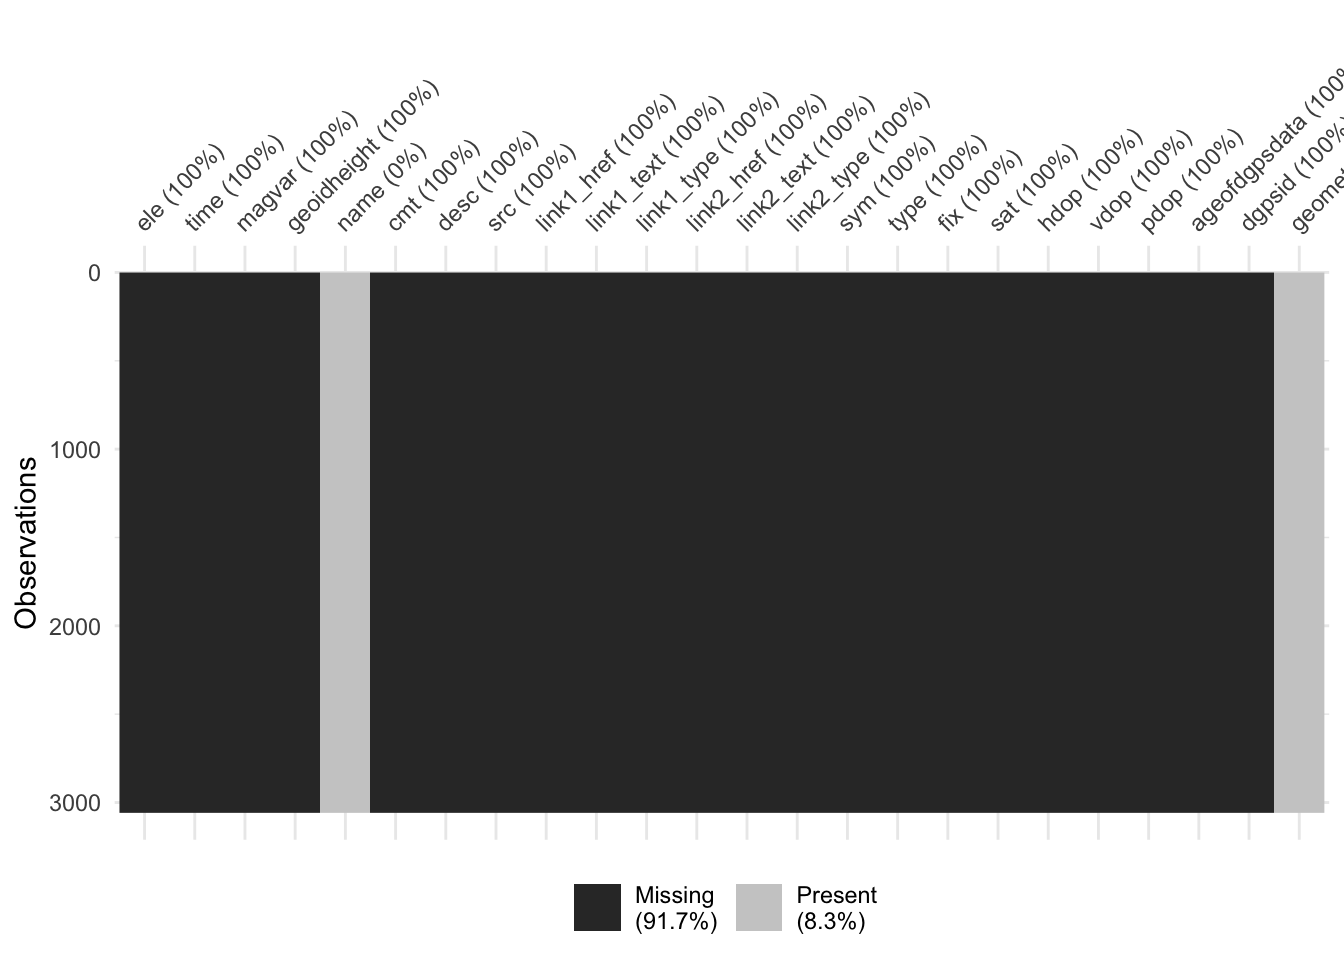
Day 2: lines

Author

Jen Richmond

Published

November 2, 2025

Sticking to the theme of walking trails in NZ, for Day 2 of the #30DayMapChallenge I am plotting the route of the Te Araroa Trail, a 3000km track that goes from the top of the North Island to the bottom of the South Island.

read data

Code
library(tidyverse)
library(sf)
library(rnaturalearth)
library(here)
library(naniar)
library(ggannotate)
library(ggeasy)

# Get NZ map
nz <- ne_countries(country = "new zealand", returnclass = "sf", scale = "large")

# Load your trail data 

trail <- st_read(here("maps", "2025-11-02_lines", "gpx_data", "TeAraroaTrail_2025_26.gpx"))
Multiple layers are present in data source /Users/jenrichmond/Dropbox/ALL_R_stuff/2. WEBSITES/jenrichmond.github.io/maps/2025-11-02_lines/gpx_data/TeAraroaTrail_2025_26.gpx, reading layer `waypoints'.
Use `st_layers' to list all layer names and their type in a data source.
Set the `layer' argument in `st_read' to read a particular layer.
Reading layer `waypoints' from data source 
  `/Users/jenrichmond/Dropbox/ALL_R_stuff/2. WEBSITES/jenrichmond.github.io/maps/2025-11-02_lines/gpx_data/TeAraroaTrail_2025_26.gpx' 
  using driver `GPX'
Simple feature collection with 3058 features and 23 fields
Geometry type: POINT
Dimension:     XY
Bounding box:  xmin: 167.7707 ymin: -46.62184 xmax: 175.6654 ymax: -34.4267
Geodetic CRS:  WGS 84

explore data

This is my first time reading .gpx data into R and it looks like a WHOLE LOT of NAs. It is possible that there is useful information in some of these variables, and naniar::vis_miss() is a good way to check. It seems that only the name variable and the geometry variable have any data at all, so I am going to select just those.

Code
glimpse(trail)
Rows: 3,058
Columns: 24
$ ele           <dbl> NA, NA, NA, NA, NA, NA, NA, NA, NA, NA, NA, NA, NA, NA, …
$ time          <dttm> NA, NA, NA, NA, NA, NA, NA, NA, NA, NA, NA, NA, NA, NA,…
$ magvar        <dbl> NA, NA, NA, NA, NA, NA, NA, NA, NA, NA, NA, NA, NA, NA, …
$ geoidheight   <dbl> NA, NA, NA, NA, NA, NA, NA, NA, NA, NA, NA, NA, NA, NA, …
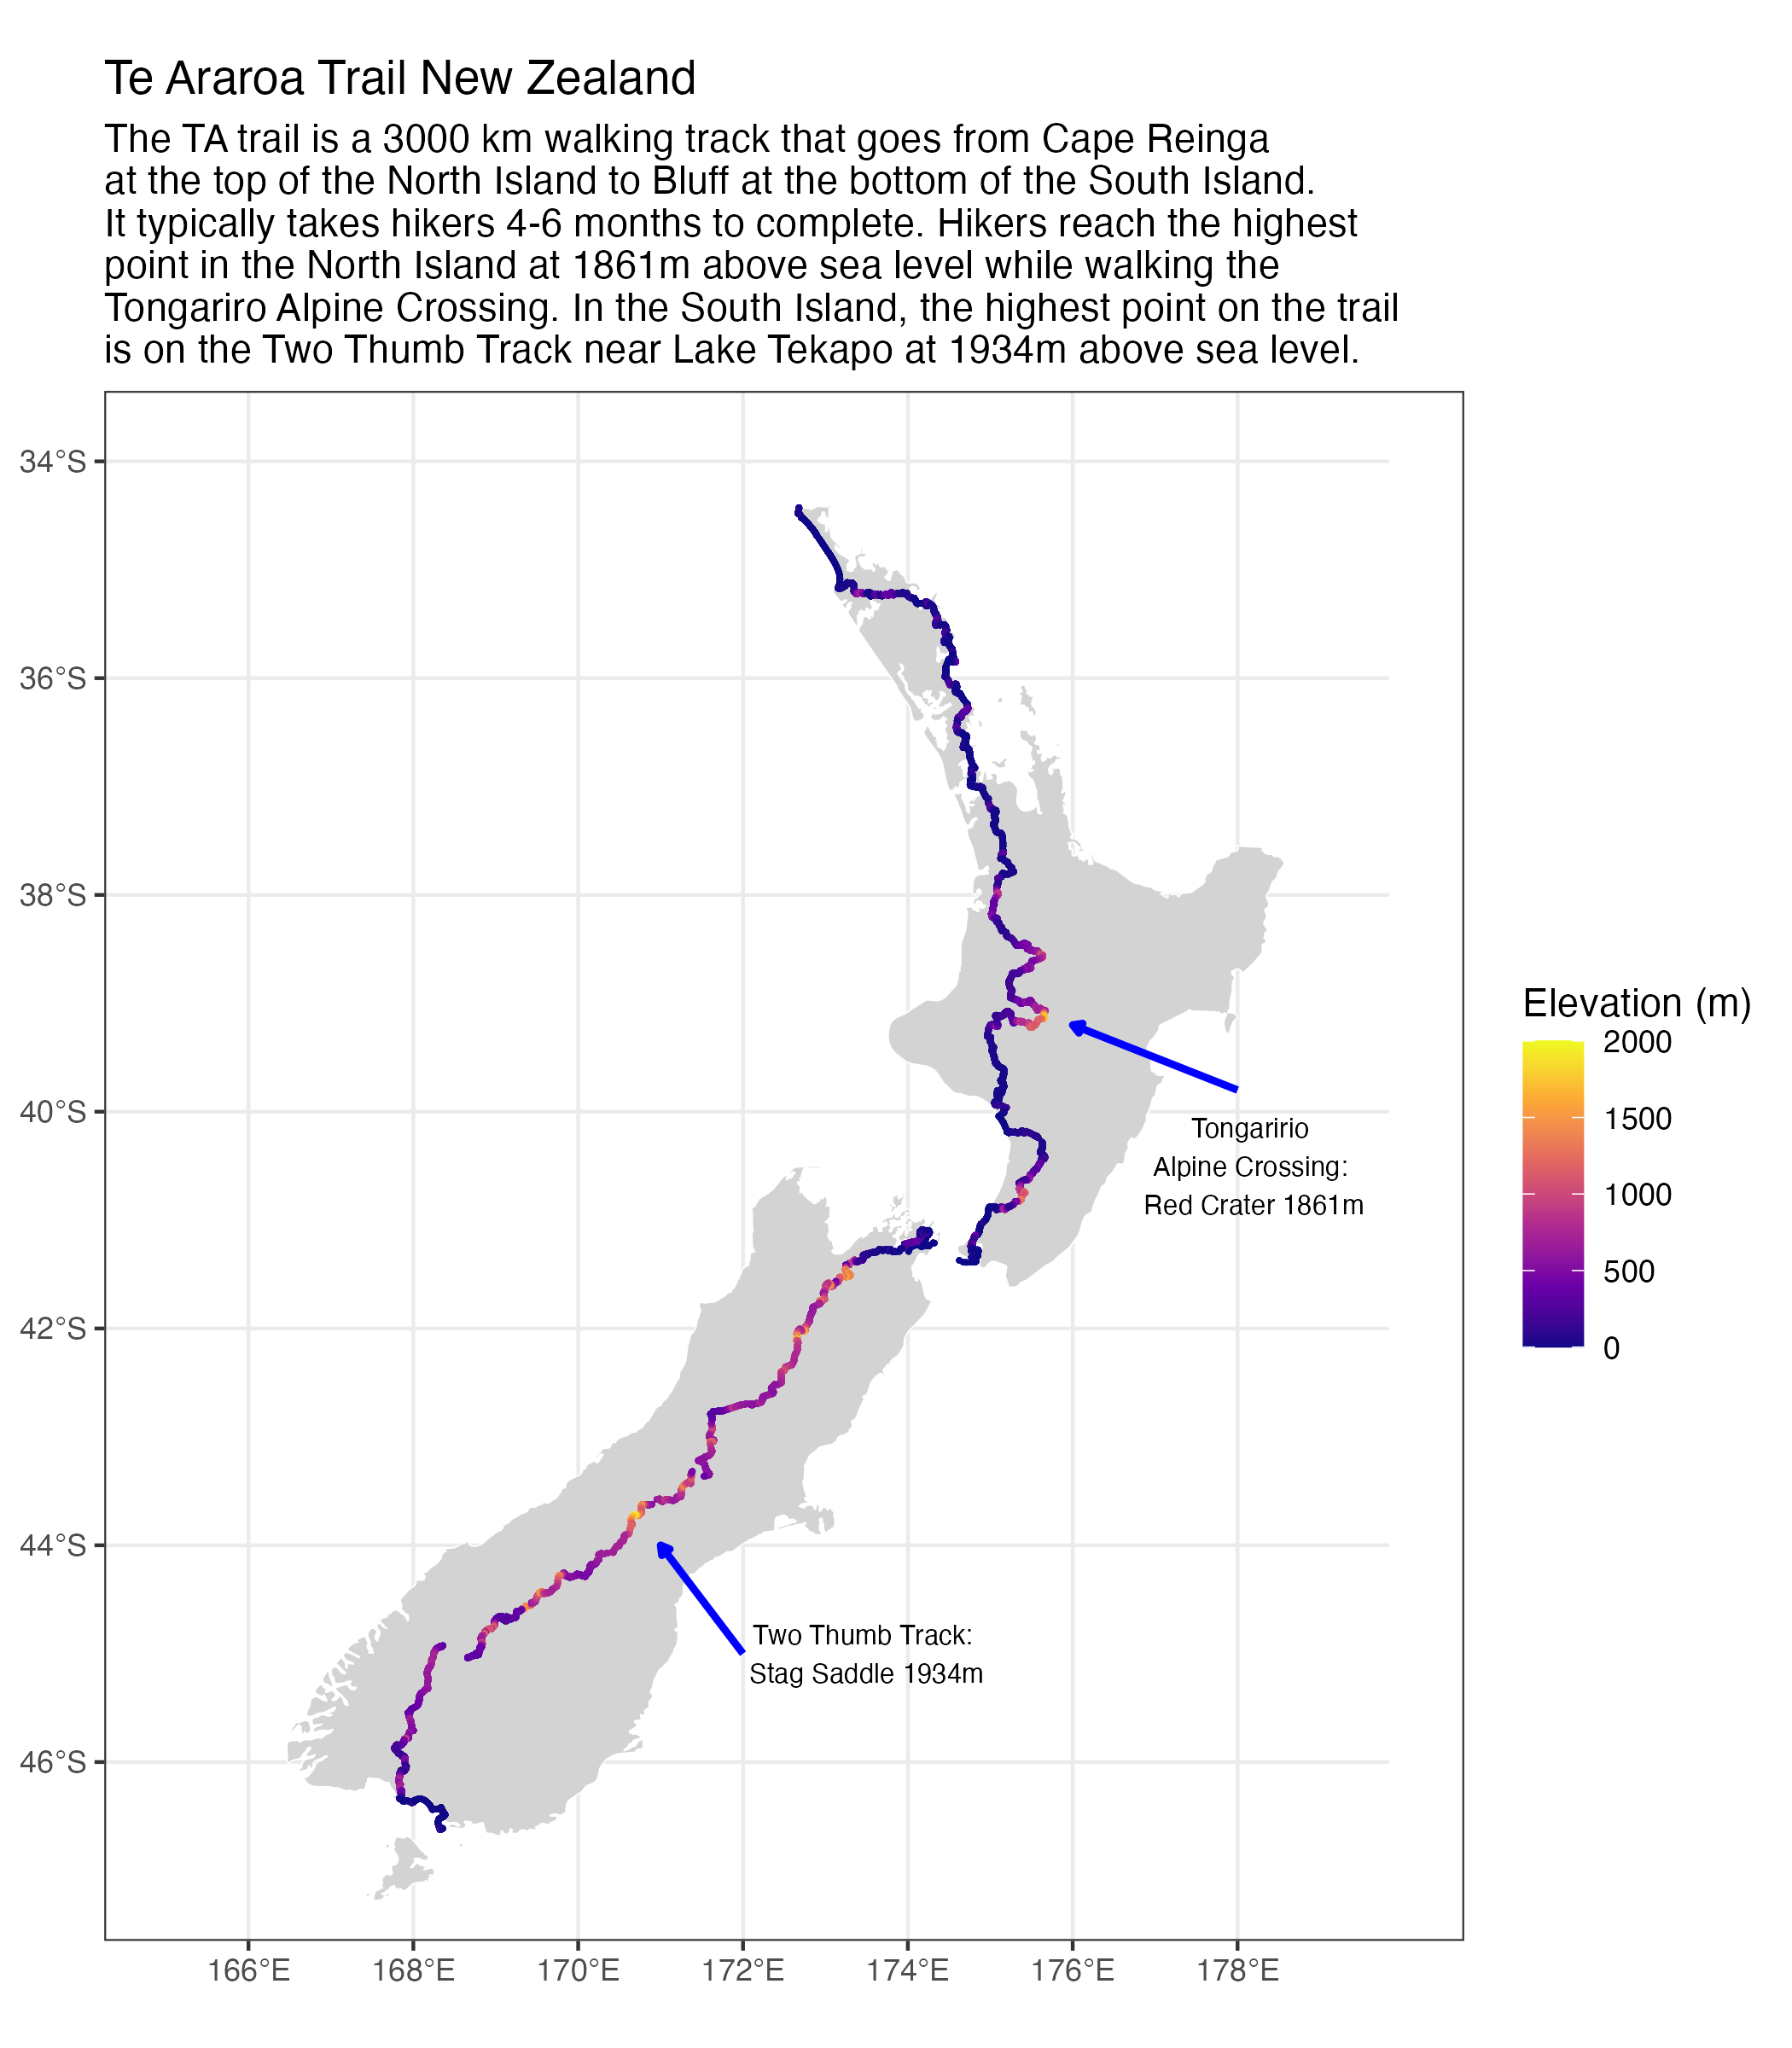
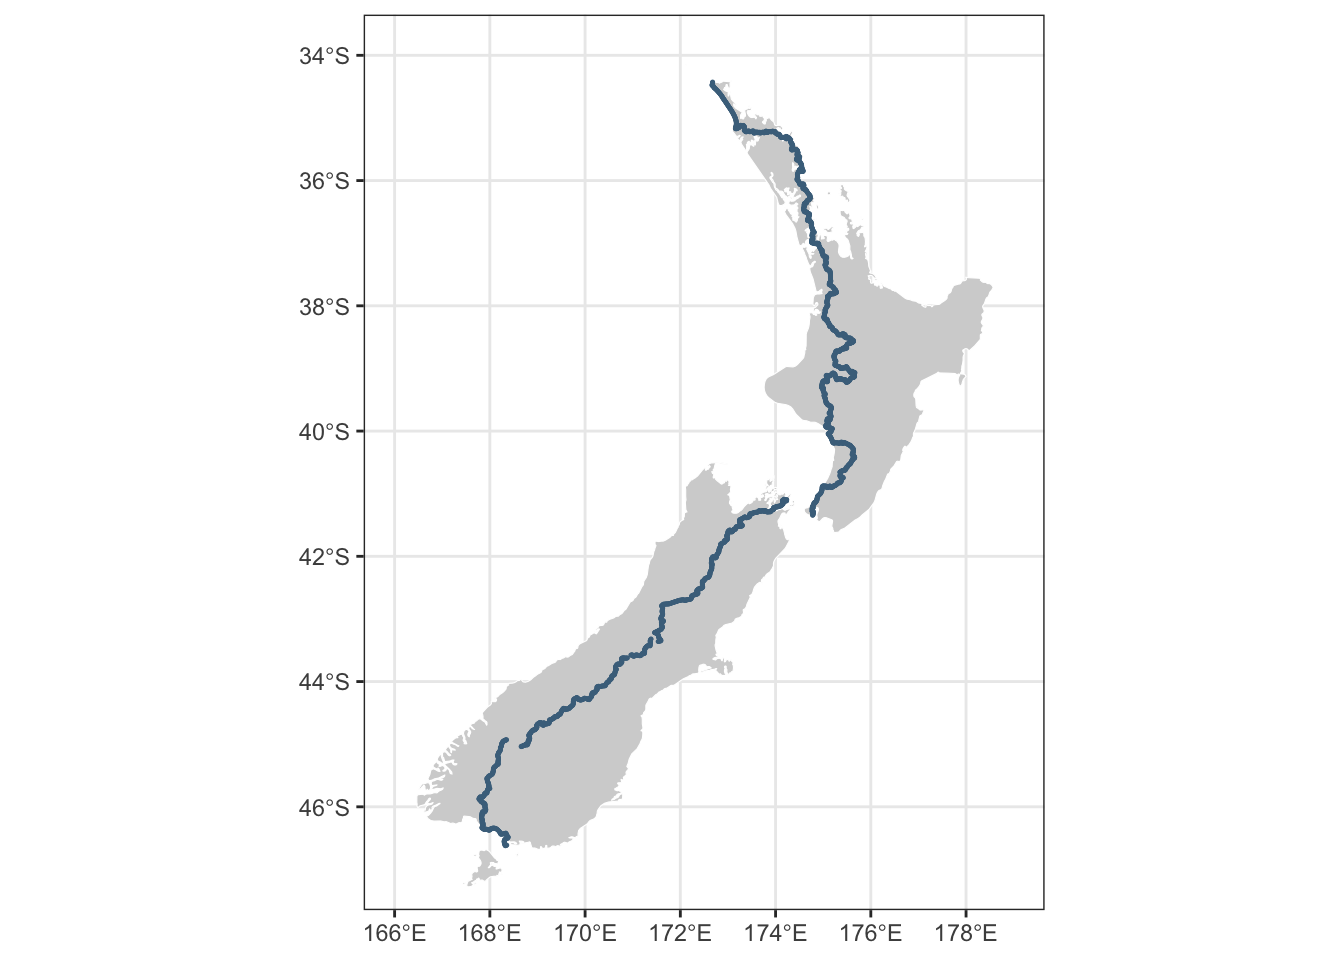
$ name          <chr> "0 km", "1 km", "2 km", "3 km", "4 km", "5 km", "6 km", …
$ cmt           <chr> NA, NA, NA, NA, NA, NA, NA, NA, NA, NA, NA, NA, NA, NA, …
$ desc          <chr> NA, NA, NA, NA, NA, NA, NA, NA, NA, NA, NA, NA, NA, NA, …
$ src           <chr> NA, NA, NA, NA, NA, NA, NA, NA, NA, NA, NA, NA, NA, NA, …
$ link1_href    <chr> NA, NA, NA, NA, NA, NA, NA, NA, NA, NA, NA, NA, NA, NA, …
$ link1_text    <chr> NA, NA, NA, NA, NA, NA, NA, NA, NA, NA, NA, NA, NA, NA, …
$ link1_type    <chr> NA, NA, NA, NA, NA, NA, NA, NA, NA, NA, NA, NA, NA, NA, …
$ link2_href    <chr> NA, NA, NA, NA, NA, NA, NA, NA, NA, NA, NA, NA, NA, NA, …
$ link2_text    <chr> NA, NA, NA, NA, NA, NA, NA, NA, NA, NA, NA, NA, NA, NA, …
$ link2_type    <chr> NA, NA, NA, NA, NA, NA, NA, NA, NA, NA, NA, NA, NA, NA, …
$ sym           <chr> NA, NA, NA, NA, NA, NA, NA, NA, NA, NA, NA, NA, NA, NA, …
$ type          <chr> NA, NA, NA, NA, NA, NA, NA, NA, NA, NA, NA, NA, NA, NA, …
$ fix           <chr> NA, NA, NA, NA, NA, NA, NA, NA, NA, NA, NA, NA, NA, NA, …
$ sat           <int> NA, NA, NA, NA, NA, NA, NA, NA, NA, NA, NA, NA, NA, NA, …
$ hdop          <dbl> NA, NA, NA, NA, NA, NA, NA, NA, NA, NA, NA, NA, NA, NA, …
$ vdop          <dbl> NA, NA, NA, NA, NA, NA, NA, NA, NA, NA, NA, NA, NA, NA, …
$ pdop          <dbl> NA, NA, NA, NA, NA, NA, NA, NA, NA, NA, NA, NA, NA, NA, …
$ ageofdgpsdata <dbl> NA, NA, NA, NA, NA, NA, NA, NA, NA, NA, NA, NA, NA, NA, …
$ dgpsid        <int> NA, NA, NA, NA, NA, NA, NA, NA, NA, NA, NA, NA, NA, NA, …
$ geometry      <POINT [°]> POINT (172.6776 -34.4267), POINT (172.6774 -34.433…
Code
vis_miss(trail)

Code
ta <- trail %>%
  select(name, geometry)

plot trail

Code
ggplot() +
  geom_sf(data = nz, fill = "lightgray", color = "white") +
  geom_sf(data = ta, color = "skyblue4", size = 0.2)  +
  coord_sf(xlim = c(166, 179), ylim = c(-47, -34)) +
  theme_bw()

plot sections

The whole trail gpx file doesn’t have elevation data, so I have downloaded all the files for each trail section and I am reading them all into into single dataframe, pulling section number and name out of filename. There are also parts of the route that through hikers typically bypass to avoid dangerous rivers or sections of road that are not worth walking, so I am filtering out those bypass sections too.

Code
gpx_files <- list.files(here("maps", "2025-11-02_lines", "gpx_data", "routes"), 
                        pattern = "\\.gpx$", 
                        full.names = TRUE)

all_routes <- gpx_files %>%
  set_names(basename(gpx_files)) %>% # use filename as names 
  map_dfr(
    ~st_read(.x, layer = "track_points", quiet = TRUE), 
    .id = "filename"
  ) %>%
  mutate(route_section = tools::file_path_sans_ext(filename)) %>%
  mutate(route_number = parse_number(route_section)) %>%
  select(route_number, route_section, track_seg_point_id, ele, geometry) %>%
  mutate(bypass = str_detect(route_section, "Bypass")) 

ta_trail <- all_routes %>%
  filter(bypass == FALSE)


map <- ggplot() +
  geom_sf(data = nz, fill = "lightgray", color = "white") +
  geom_sf(data = ta_trail, aes(color = ele), size = 0.2) +
  scale_color_viridis_c(option = "plasma", name = "Elevation (m)", 
                        limits = c(0, 2000), breaks = seq(0, 2000, by = 500)) +
  coord_sf(xlim = c(165, 180), ylim = c(-47, -34)) +
  theme_bw() +
  labs(title = "Te Araroa Trail New Zealand", subtitle = "The TA trail is a 3000 km walking track that goes from Cape Reinga \nat the top of the North Island to Bluff at the bottom of the South Island. \nIt typically takes hikers 4-6 months to complete. Hikers reach the highest \npoint in the North Island at 1861m above sea level while walking the \nTongariro Alpine Crossing. In the South Island, the highest point on the trail \nis on the Two Thumb Track near Lake Tekapo at 1934m above sea level.") +
  geom_text(data = data.frame(x = 173.5, y = -45, label = "Two Thumb Track: \nStag Saddle 1934m"),
          mapping = aes(x = x, y = y, label = label),
          size = 2.65, inherit.aes = FALSE) +
  geom_text(data = data.frame(x = 178.2, y = -40.5, label = "Tongaririo \nAlpine Crossing: \nRed Crater 1861m"),
          mapping = aes(x = x, y = y, label = label),
        size = 2.65, inherit.aes = FALSE) +
  geom_segment(aes(x = 172, y = -45, xend = 171, yend = -44),
    arrow = arrow(length = unit(0.1, "cm"), type = "closed"),
    color = "blue",
    linewidth  = 1
  ) +
  geom_segment(aes(x = 178, y = -39.8, xend = 176, yend = -39.2),
    arrow = arrow(length = unit(0.1, "cm"), type = "closed"),
    color = "blue",
    linewidth  = 1
  ) +
  easy_remove_axes(which = c("both"), what = c("title"))