Day 3 of the challenge is polygons, so I wanted to work out how make a map that splits NZ into regions and fills the area of each by population. The spData package was a good find because it contains data about land area, population, and median income data by region. The population data was a bit out of date so here I have found 2024 estimates from StatsNZ and joined the updated population data.
get data
Code
library(tidyverse)library(here)library(sf)library(spData) # has nz map/datalibrary(janitor)library(scales)nz <- nz nz_regions <- nz %>%select(Name, geom)# Stats NZ subnational population estimates (RC, constituency), by age and sex, at 30 June 2023-24 (2023 boundaries)# clean to get more recent data, remove totals, name variable names match nz df so that join workspop <-read_csv(here("maps", "2025-11-03_polygon", "statsNZ_pop_region.csv")) %>%clean_names() pop_total <- pop %>%filter(area =="Total New Zealand by regional councils") %>%filter(year_at_30_june ==2024)totalNZpop24 <- pop_total$obs_valuepop_region <- pop %>%filter(year_at_30_june ==2024) %>%filter(area !="Total New Zealand by regional councils") %>%select(Name = area, Population24 = obs_value) %>%mutate(Name =str_remove(Name, "region")) %>%mutate(Name =str_trim(Name)) %>%mutate(Name =str_replace_all(Name, "ū", "u")) %>%mutate(Name =str_replace_all(Name, "Wh", "W"))# note: when joining always put the sf dataframe first, so that it keeps geom infonzpop24 <-left_join(nz, pop_region, by ="Name") %>%rowwise() %>%mutate(proportion = (Population24/totalNZpop24)*100)northsouth <- nzpop24 %>%group_by(Island) %>%summarise(pop =sum(proportion))
plot
Code
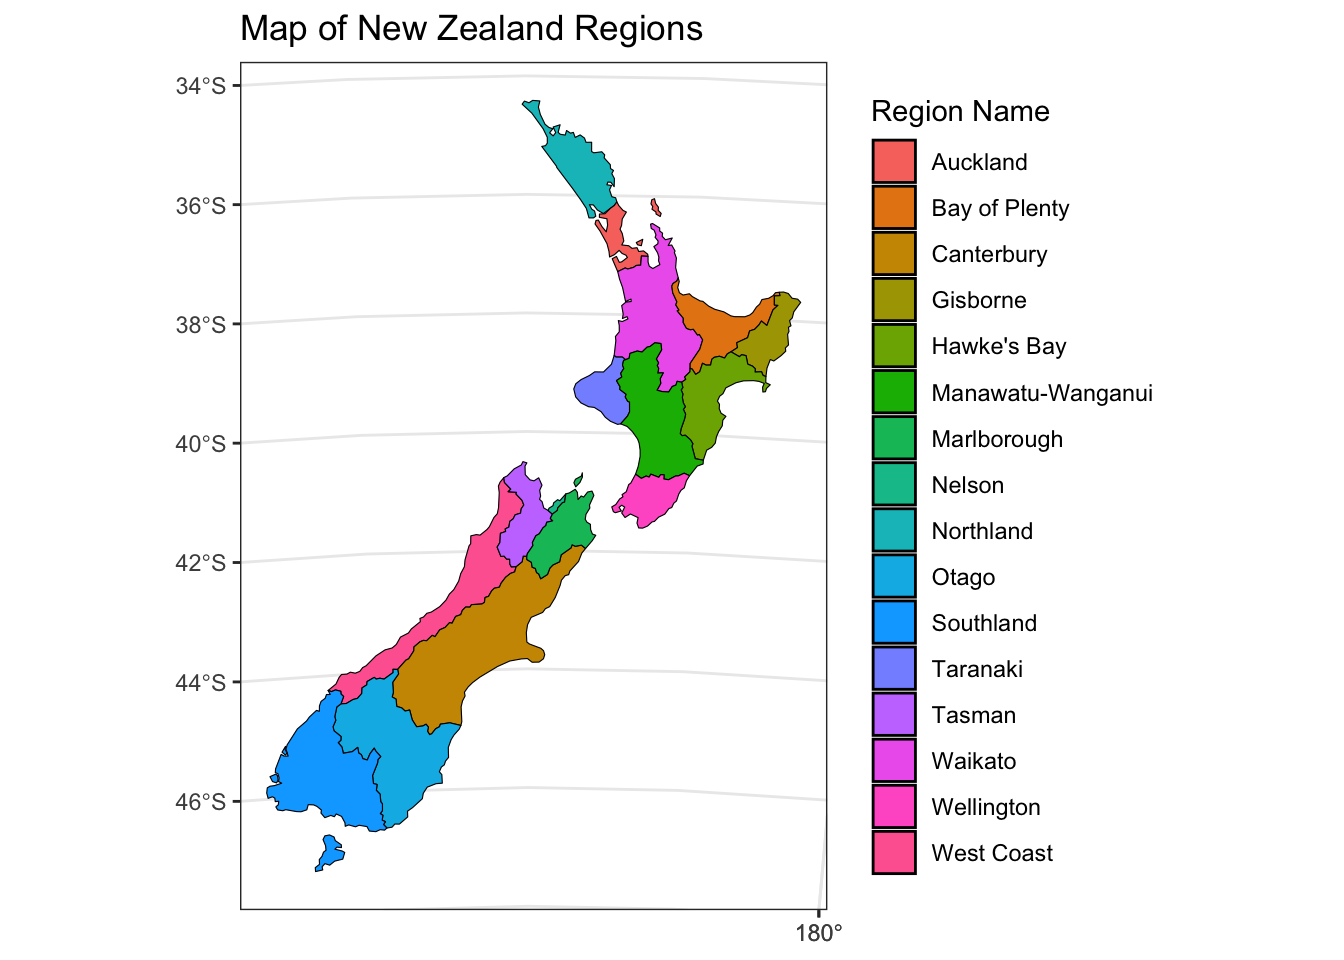
ggplot(data = nz) +geom_sf(aes(fill = Name), color ="black") +labs(title ="Map of New Zealand Regions", fill ="Region Name") +theme_bw()
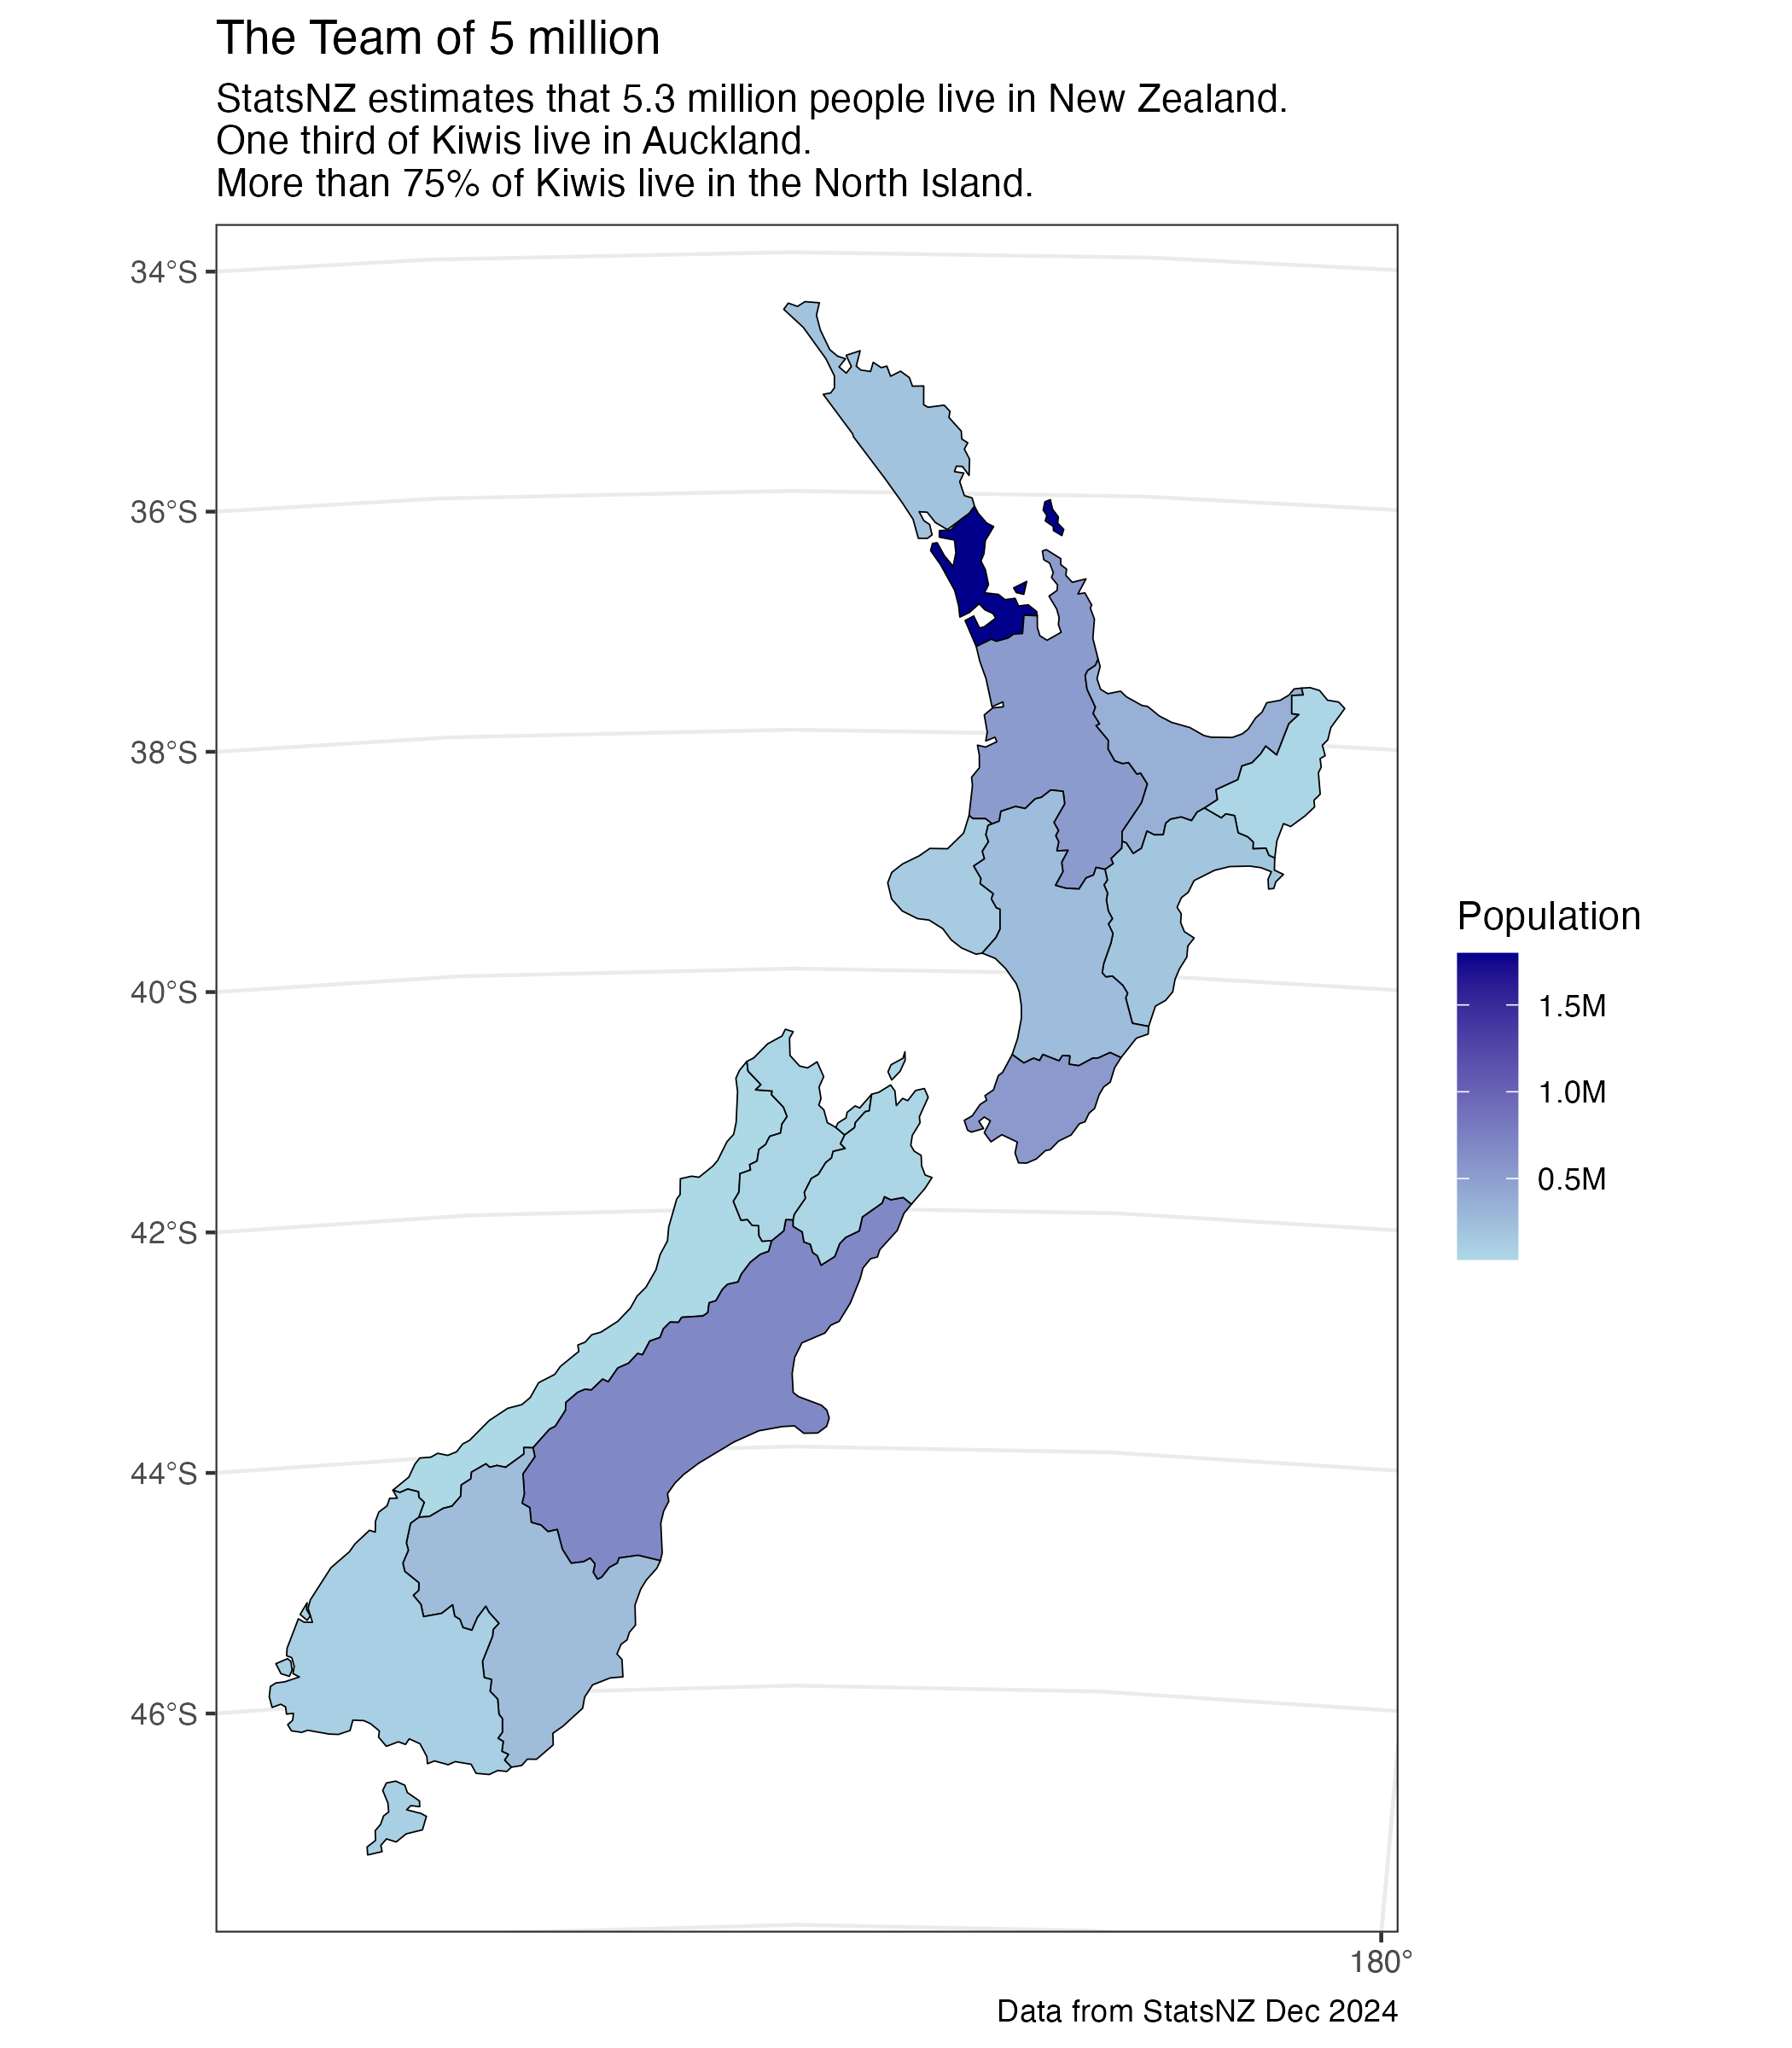
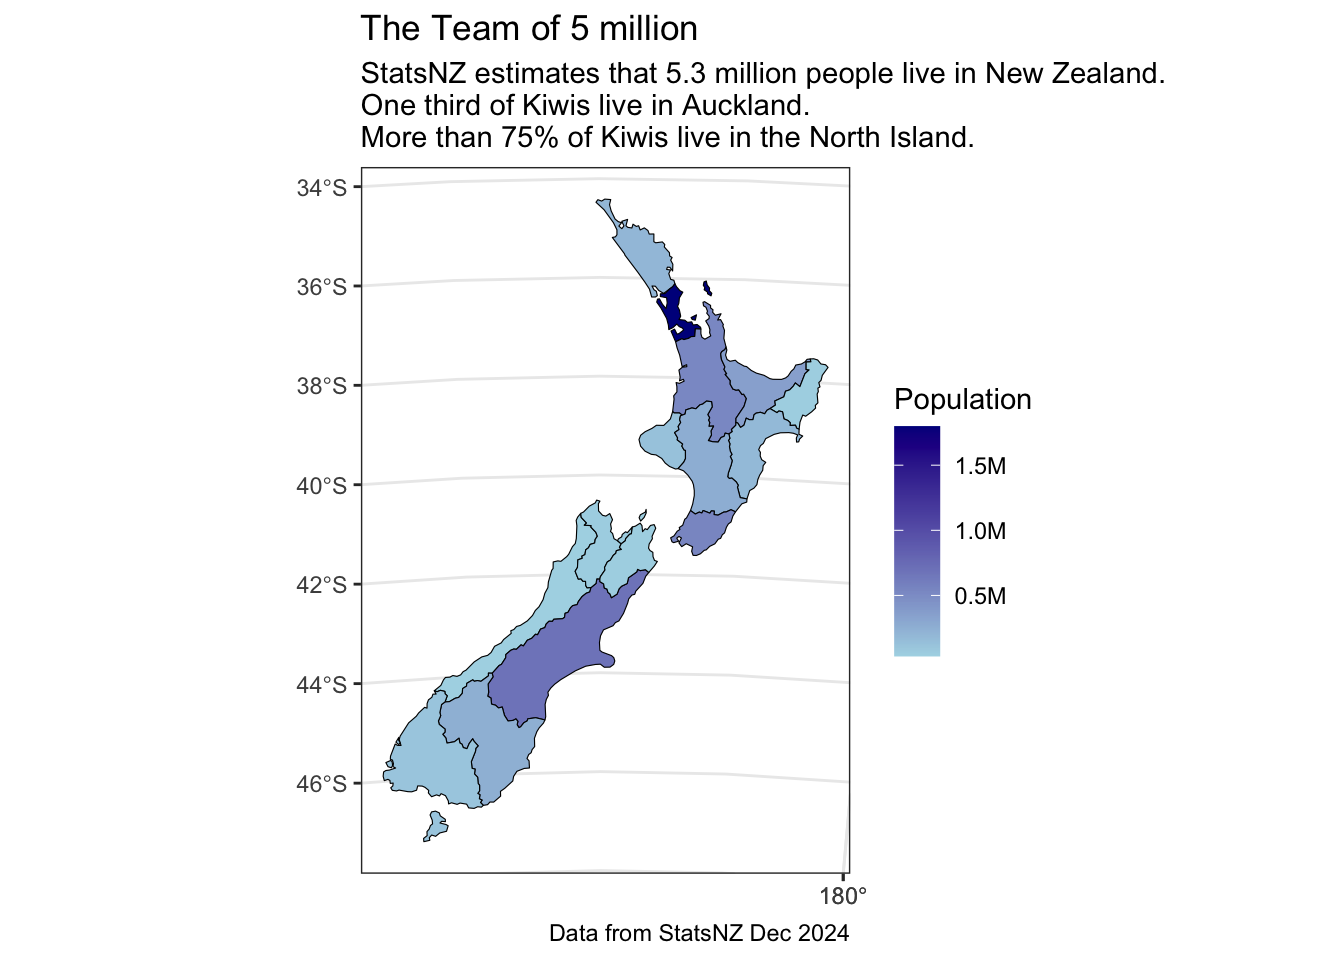
Code
ggplot(data = nzpop24) +geom_sf(aes(fill = Population24), color ="black") +# Fill by region name and add black borderslabs(title ="The Team of 5 million", fill ="Population", subtitle ="StatsNZ estimates that 5.3 million people live in New Zealand. \nOne third of Kiwis live in Auckland. \nMore than 75% of Kiwis live in the North Island.", caption ="Data from StatsNZ Dec 2024") +scale_fill_gradient(low ="lightblue", high ="darkblue", labels =label_number(scale =1e-6, suffix ="M")) +theme_bw()