Code
library(tidyverse)
library(maps)
library(tidygeocoder)
library(ggeasy)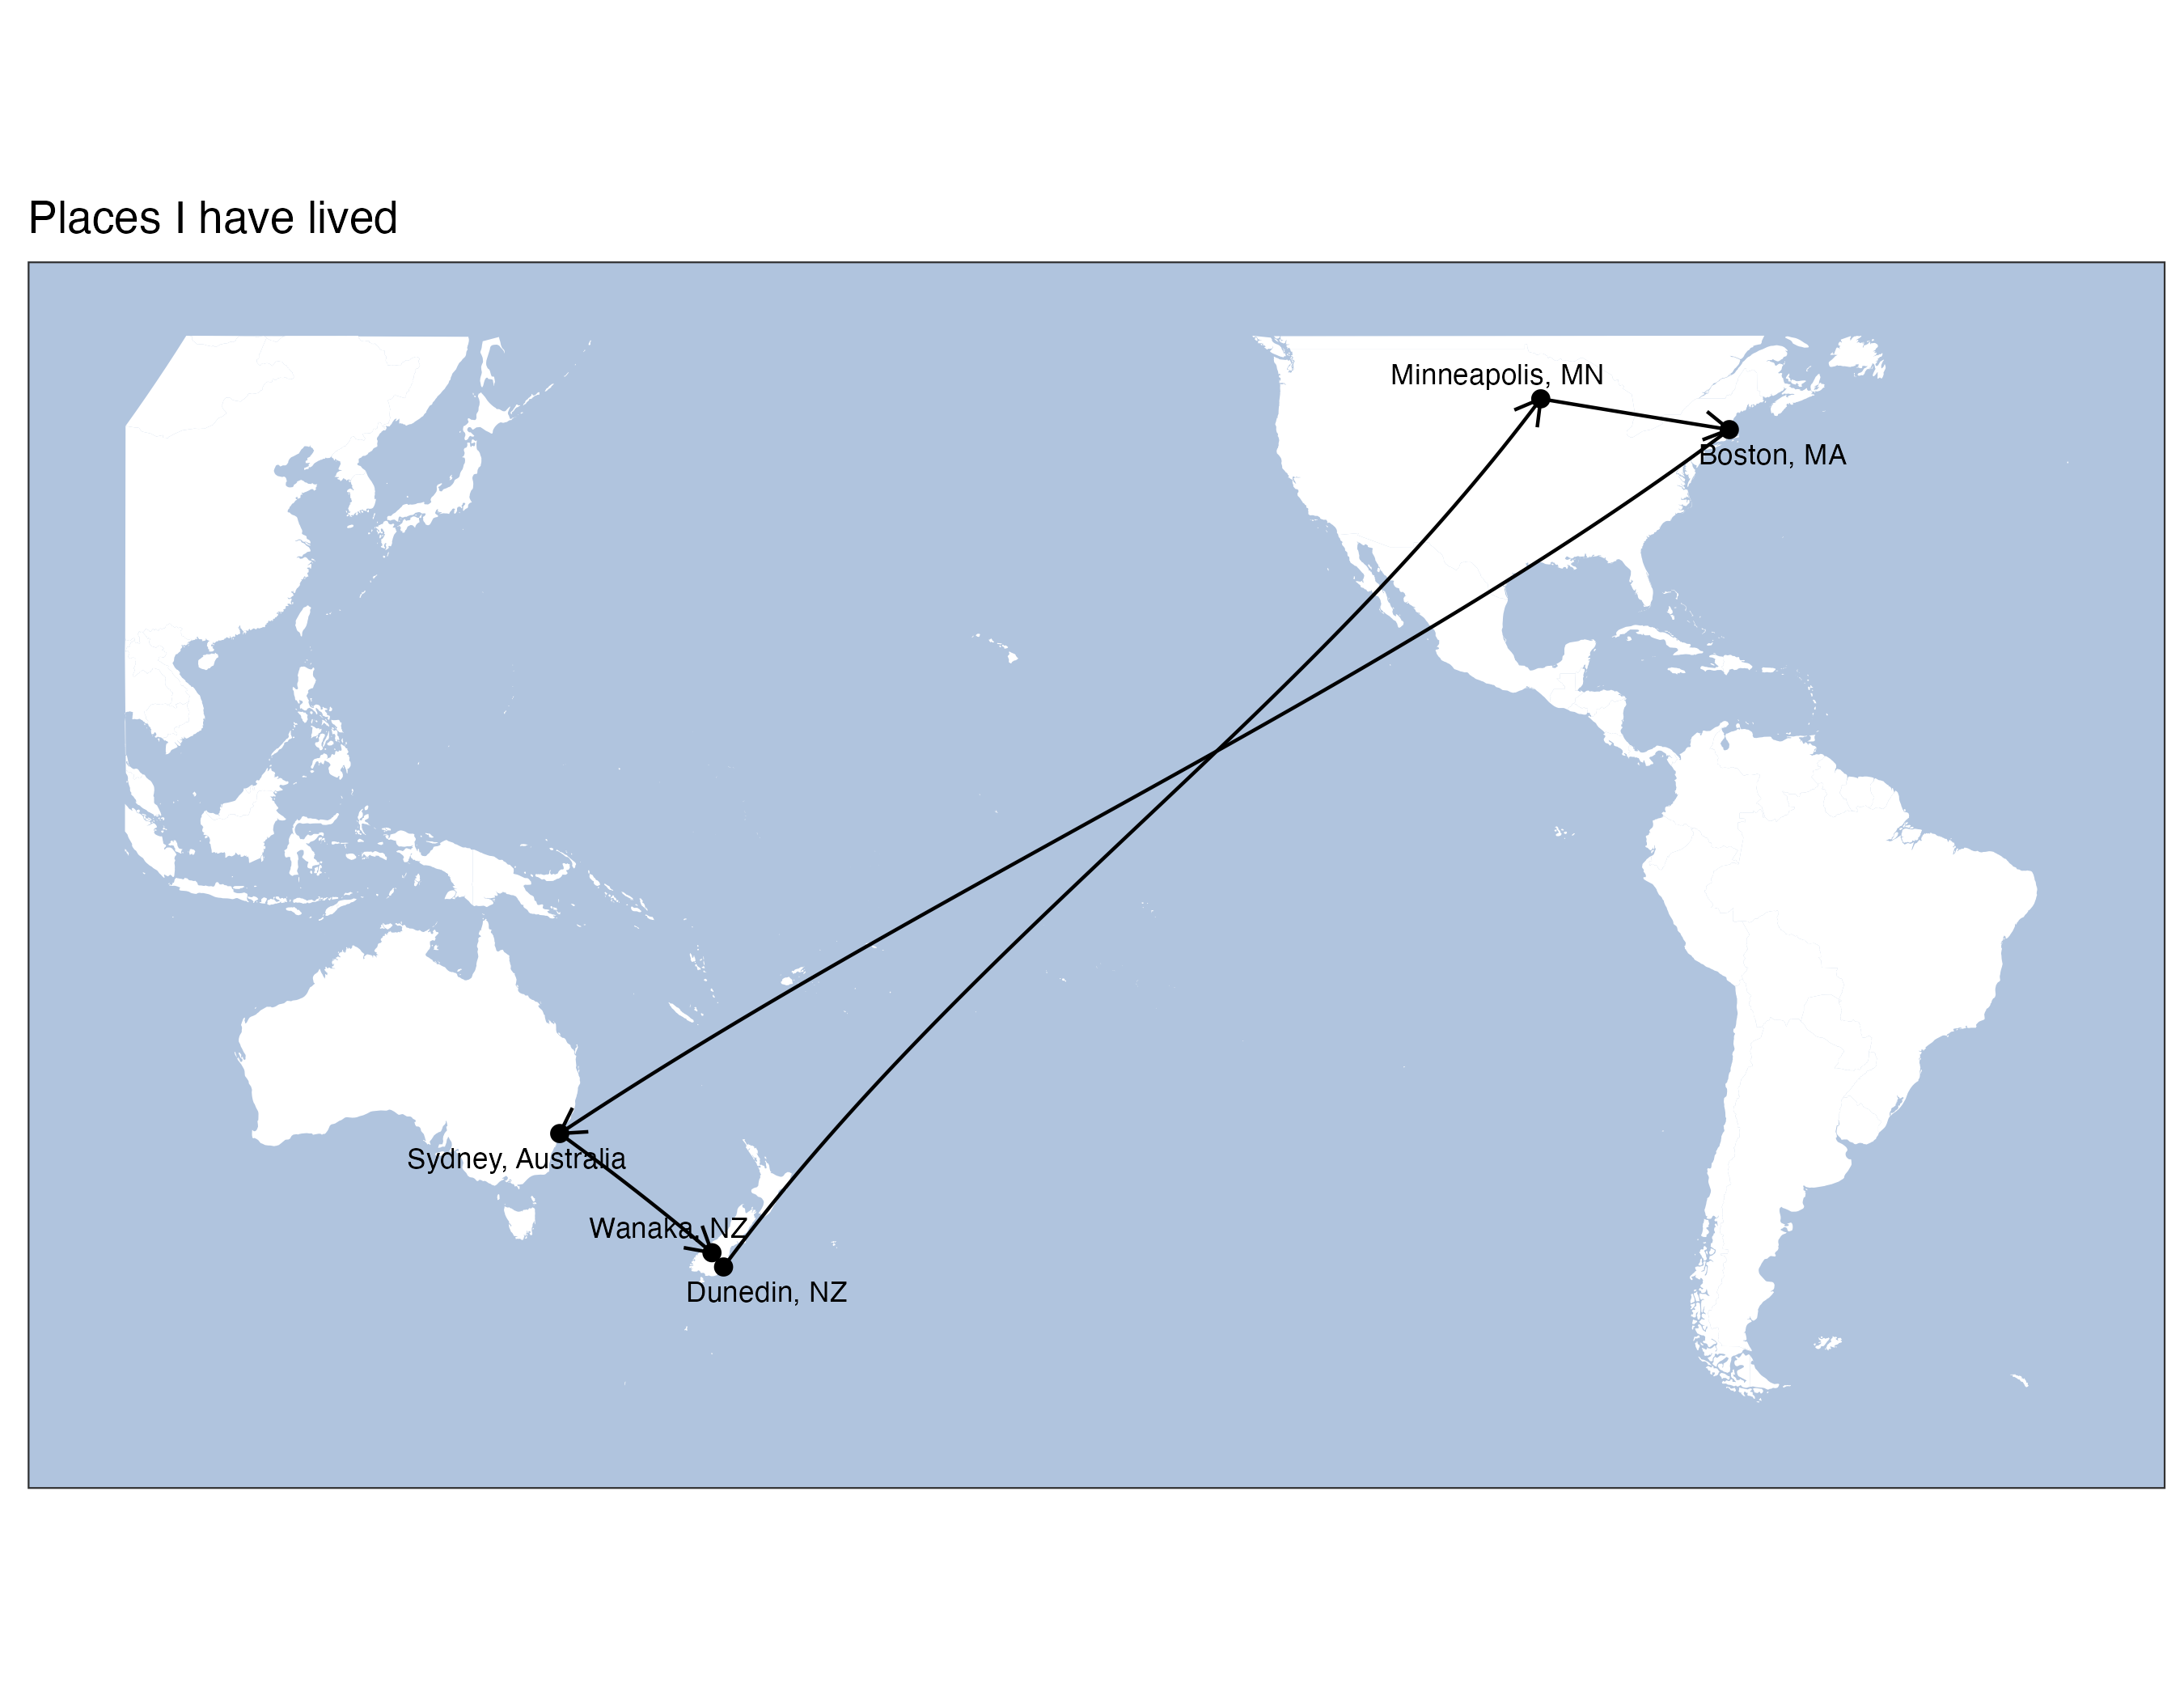
library(ggrepel)Inspired by this bluesky post from Andrew Heiss, today made a map of all the places I have lived.
library(tidyverse)
library(maps)
library(tidygeocoder)
library(ggeasy)
library(ggrepel)Code to get pacific centred map from Free Range Stats
mp1 <- fortify(maps::map(fill=TRUE, plot=FALSE)) |>
  as_tibble()

mp2 <- mp1 |>
  mutate(long = long + 360,
         group = group + max(mp1$group) + 1)

mp <- rbind(mp1, mp2) |>
  filter(long > 100  & long <330 & lat <50 & lat > -60)

ggplot(mp) +
  geom_polygon(aes(x = long, y = lat, group = group), fill = "white") +
  coord_map() +
  theme_bw() +
  easy_remove_gridlines() +
  easy_remove_axes() +
theme(panel.background = element_rect(fill = "lightsteelblue")) 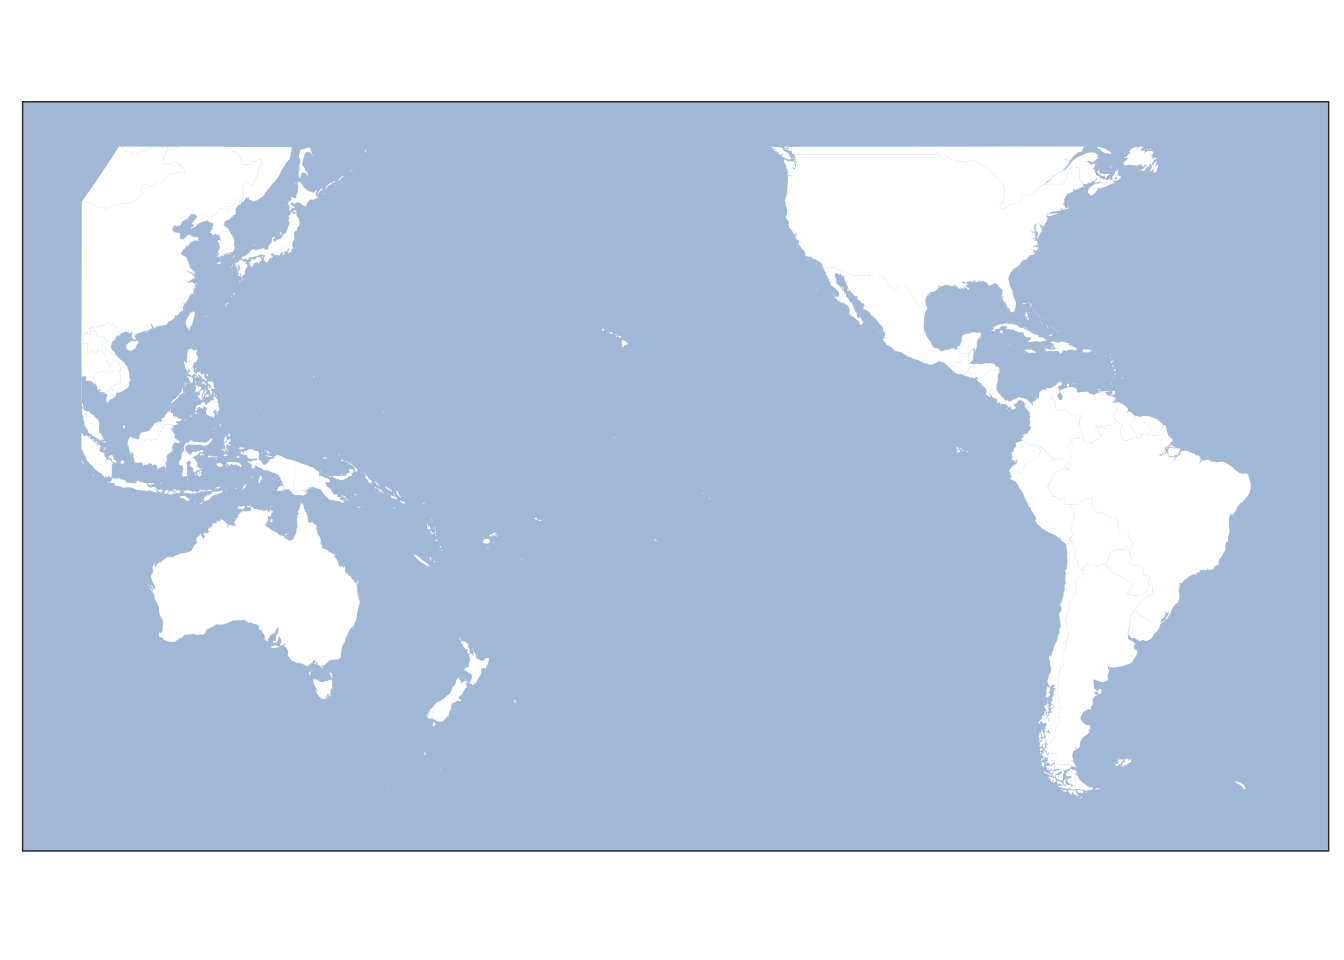
# tidygeocoder is magic! make a df of places, feed it to geocode() and it will add lat/long columns!

places <- tibble::tribble(
~name,                  ~places, ~period, ~order,
"uni",          "Dunedin, NZ", "2017-2004", 1,
"postdoc",  "Minneapolis, MN",     "2004-2005", 2,
"postdoc",         "Boston, MA" , "2005-2008", 3,
"unsw",         "Sydney, Australia"  ,"2008-2022", 4,
"home",         "Wanaka, NZ" , "2022-present", 5
)

lat_longs <- places %>%
  geocode(places, method = 'osm', lat = latitude , long = longitude) %>%
  mutate(longitude = ifelse(longitude < 0, longitude + 360, longitude)) # transform to get pacific centred


ggplot(mp) +
  geom_polygon(aes(x = long, y = lat, group = group), fill = "white") +
   coord_map() +
  geom_point(data = lat_longs, aes(x = longitude, y = latitude),
           size = 2, color = "black", fill = "black", shape = 21,
           inherit.aes = FALSE) +
 geom_text_repel(data = lat_longs, aes(x = longitude, y = latitude, label = places), size = 3) +
  theme_bw() +
  easy_remove_gridlines() +
  easy_remove_axes() +
theme(panel.background = element_rect(fill = "lightsteelblue")) 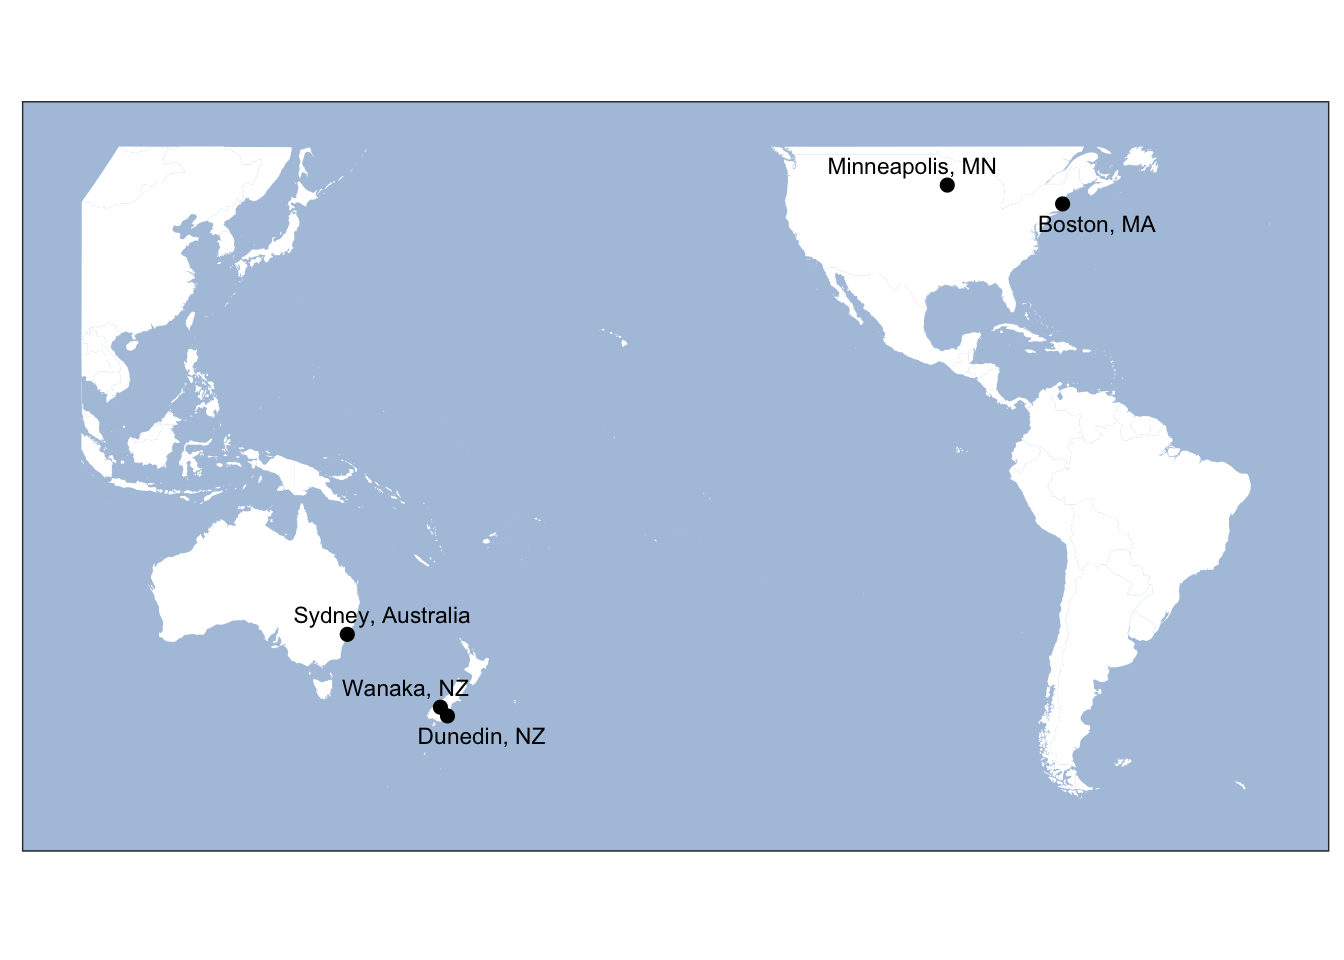
pairs <- lat_longs %>%
  mutate(next_longitude = lead(longitude),
    next_latitude = lead(latitude),
    next_place = lead(places),
    next_order = lead(order))


ggplot(mp) +
  geom_polygon(aes(x = long, y = lat, group = group), fill = "white") +
   coord_map() +
    geom_segment(data = pairs,
             aes(x = longitude, y = latitude, xend = next_longitude, yend = next_latitude),
             arrow = arrow(length = unit(0.3, "cm"), type = "open", ends = "last"),
             linewidth = 0.5,
             arrow.fill = NULL) +
  geom_point(data = lat_longs, aes(x = longitude, y = latitude),
           size = 2, color = "black", fill = "black", shape = 21,
           inherit.aes = FALSE) +
 geom_text_repel(data = lat_longs, aes(x = longitude, y = latitude, label = places), size = 3) +
  theme_bw() +
  easy_remove_gridlines() +
    easy_remove_axes() +
    theme(panel.background = element_rect(fill = "lightsteelblue")) +
  labs(title = "Places I have lived")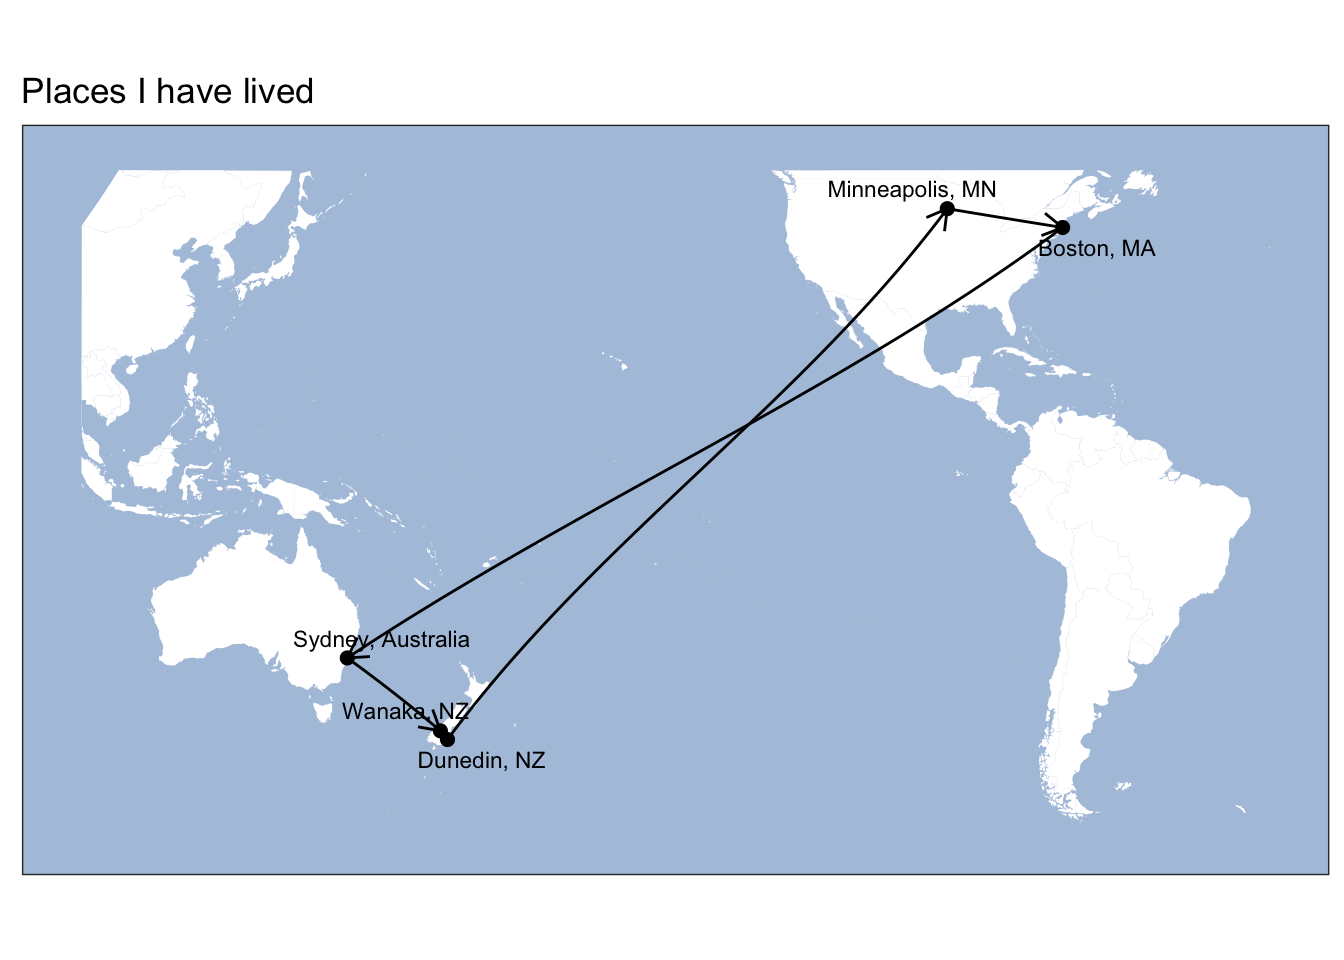
```