My friend Lisa called me with a ggplot challenge the other day. She was trying to work out how to have only some of her points labelled with annotations. Here are some notes about how you can label some points but not others.
load packages/make dataframe
Code
library (tidyverse)## make up some data <- data.frame (level = as.factor (c ("Level A" , "Level A" , "Level B" , "Level B" , "Level C" , "Level C" , "Level D" , "Level D" ,"Level E" , "Level E" )),gender = as.factor (c ("Female" ,"Male" ,"Female" ,"Male" ,"Female" ,"Male" ,"Female" ,"Male" , "Female" ,"Male" )),score = c (12 L, 23 L, 13 L, 20 L, 16 L, 18 L, 15 L, 20 L, 11 L, 22 L)glimpse (df)
Rows: 10
Columns: 3
$ level  <fct> Level A, Level A, Level B, Level B, Level C, Level C, Level D, …
$ gender <fct> Female, Male, Female, Male, Female, Male, Female, Male, Female,…
$ score  <int> 12, 23, 13, 20, 16, 18, 15, 20, 11, 22
data setup
First, check that levels are behaving and then create new variables that contain just the values you want to print on your plot.
Code
[1] "Level A" "Level B" "Level C" "Level D" "Level E"
Code
<- df %>% mutate (f_values = case_when (gender == "Female" ~ score), m_values = case_when (gender == "Male" ~ score)) glimpse (df)
Rows: 10
Columns: 5
$ level    <fct> Level A, Level A, Level B, Level B, Level C, Level C, Level D…
$ gender   <fct> Female, Male, Female, Male, Female, Male, Female, Male, Femal…
$ score    <int> 12, 23, 13, 20, 16, 18, 15, 20, 11, 22
$ f_values <int> 12, NA, 13, NA, 16, NA, 15, NA, 11, NA
$ m_values <int> NA, 23, NA, 20, NA, 18, NA, 20, NA, 22
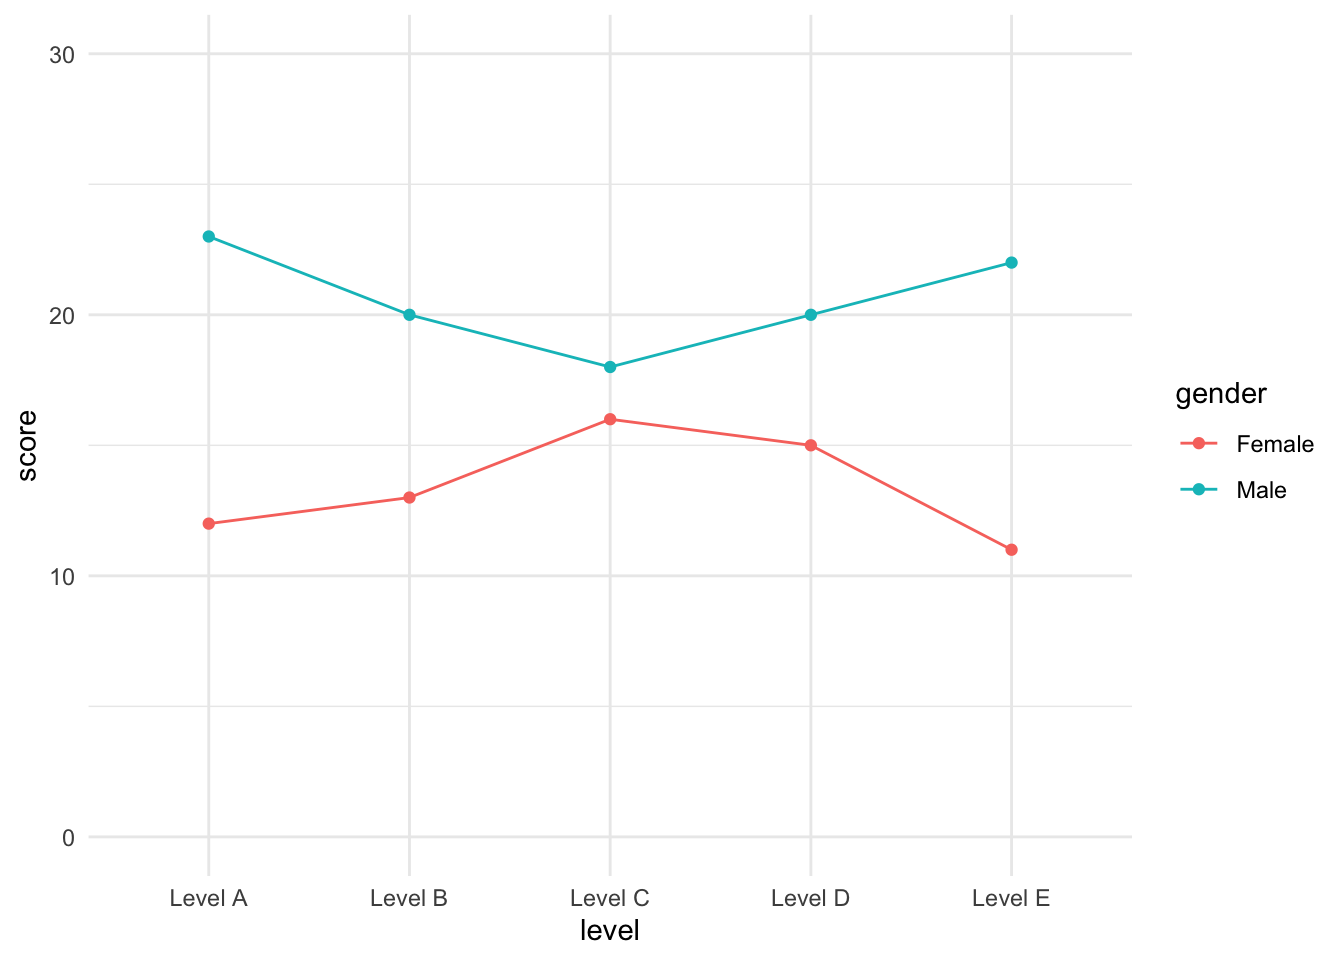
basic plot
Code
%>% ggplot (aes (x = level, y = score, colour = gender, group = gender)) + geom_point () + geom_line () + scale_y_continuous (limits = c (0 ,30 )) + theme_minimal ()
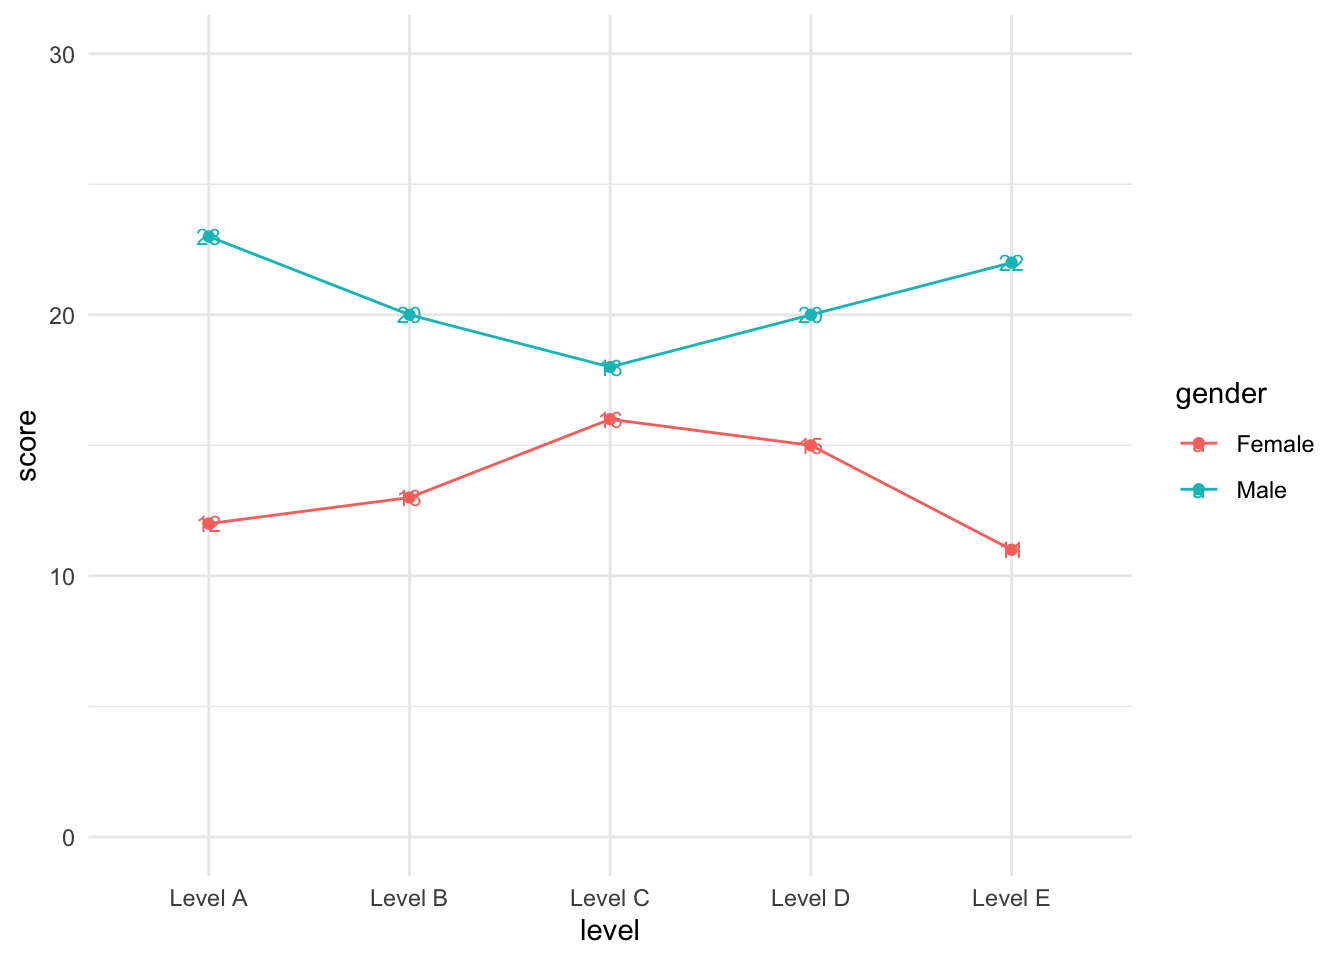
plot with selective annotations
Here we have added two geom_text() calls, one for m_values and one for f_values. Unfortunately the values end up on top of the points.
Code
%>% ggplot (aes (x = level, y = score, colour = gender, group = gender)) + geom_point () + geom_line () + scale_y_continuous (limits = c (0 ,30 )) + theme_minimal () + geom_text (aes (label = m_values), size = 3 ) + geom_text (aes (label = f_values), size = 3 )
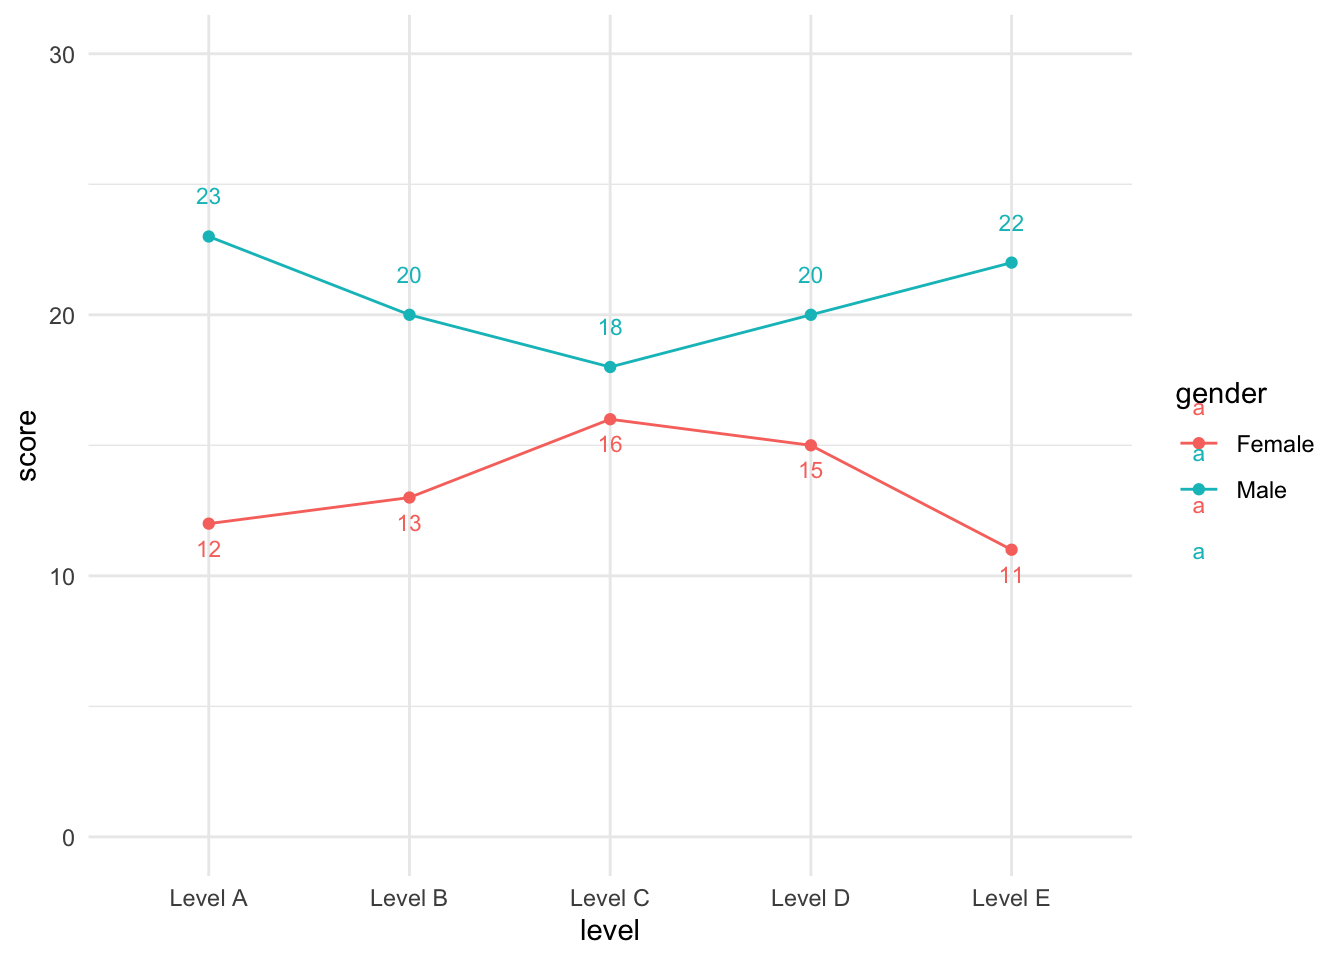
Add a little vjust to shift the points up and down a little from the points. Don’t love what has happened to the legend though…
Code
%>% ggplot (aes (x = level, y = score, colour = gender, group = gender)) + geom_point () + geom_line () + scale_y_continuous (limits = c (0 ,30 )) + theme_minimal () + geom_text (aes (label = m_values), vjust = - 2 , size = 3 ) + geom_text (aes (label = f_values), vjust = 2 , size = 3 )
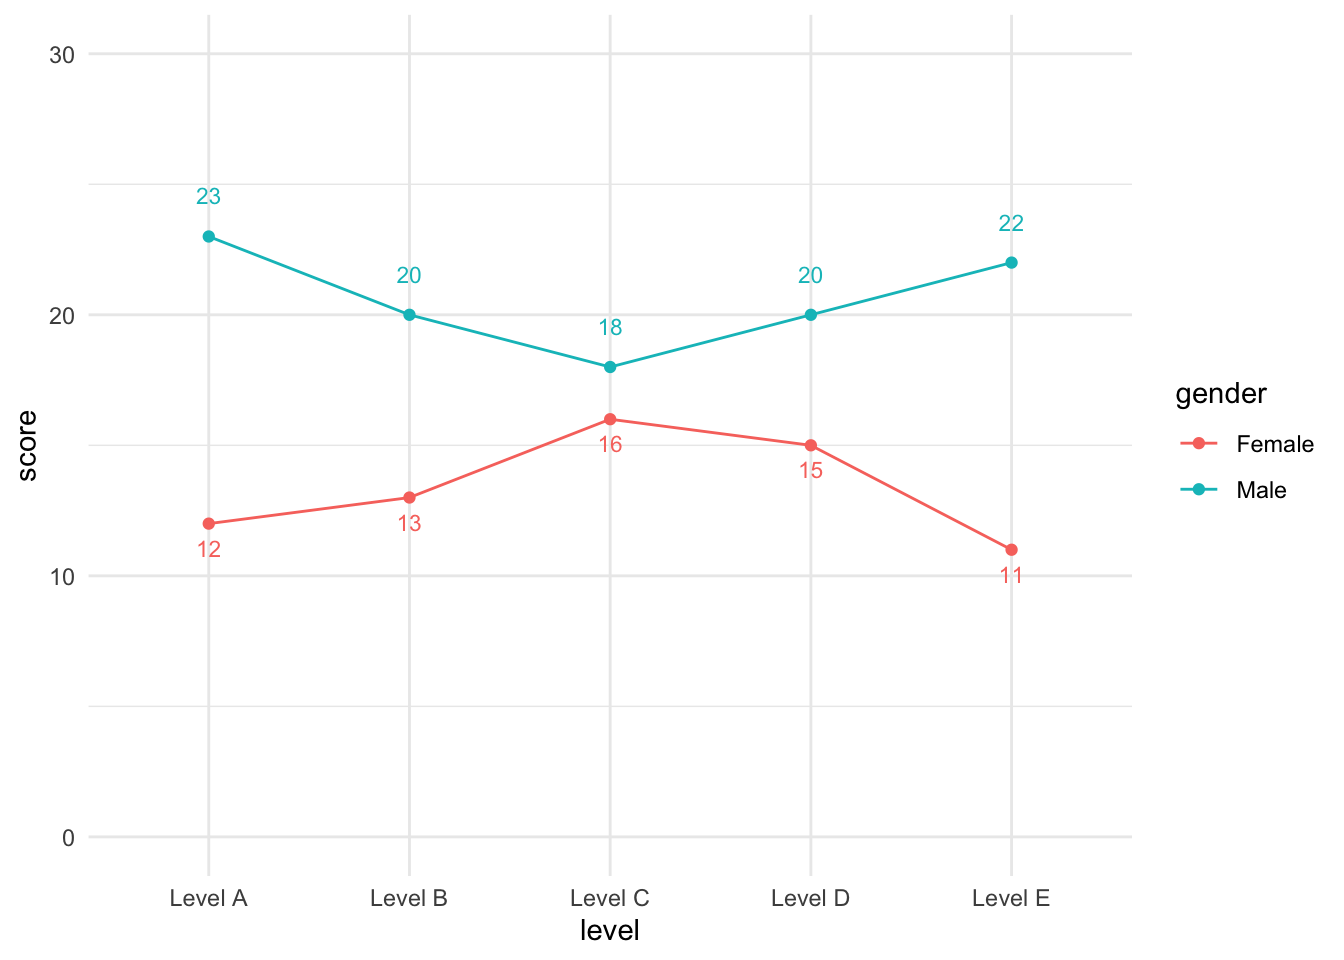
Adding show.legend = FALSE to let R know that I don’t want the text labels to appear in the legend.
Code
%>% ggplot (aes (x = level, y = score, colour = gender, group = gender)) + geom_point () + geom_line () + scale_y_continuous (limits = c (0 ,30 )) + theme_minimal () + geom_text (aes (label = m_values), vjust = - 2 , size = 3 , show.legend = FALSE ) + geom_text (aes (label = f_values), vjust = 2 , size = 3 , show.legend = FALSE )
SUCCESS!